
The Best Retail AI Platforms for Multi-Location Operations
Compare the best retail AI platforms for multi-location chains in 2026 by category, and find the layer that explains why a store is slipping.
Best Retail AI Platforms for Multi-Location Operations
The best retail AI platform for a multi-location chain depends on which layer is failing:
- Forecasting
- Store execution
- Traffic
- Local marketing
- Performance diagnosis
The gap that costs the most margin is the fifth: knowing why a specific store is slipping, every week, before the P&L shows it.
That fifth layer is what AI performance management ia all about. It is also the layer most retail AI tools skip.
This guide covers:
- The six categories of retail AI in use across multi-location chains in 2026
- Which platforms lead each category, and what each one will not tell you
- How AI helps regional and district managers spot underperforming stores
- A seven-point framework for choosing a platform, built for COOs and heads of stores
Built for the businesses that run everywhere at once.
Scoop exists to bring best-in-class operational diagnostics to every distributed business, not just the ones big enough to staff a team for it. Meet the people building it.
- Operator-first by design
- Built for distributed teams
- Diagnostics, not dashboards
What is a multi-location retail AI platform?
A multi-location retail AI platform is software that uses machine learning, language models, or computer vision to help a chain make better decisions across many stores at once.
At one store, a sharp manager catches most problems by walking the floor. At 200 stores, nobody can.
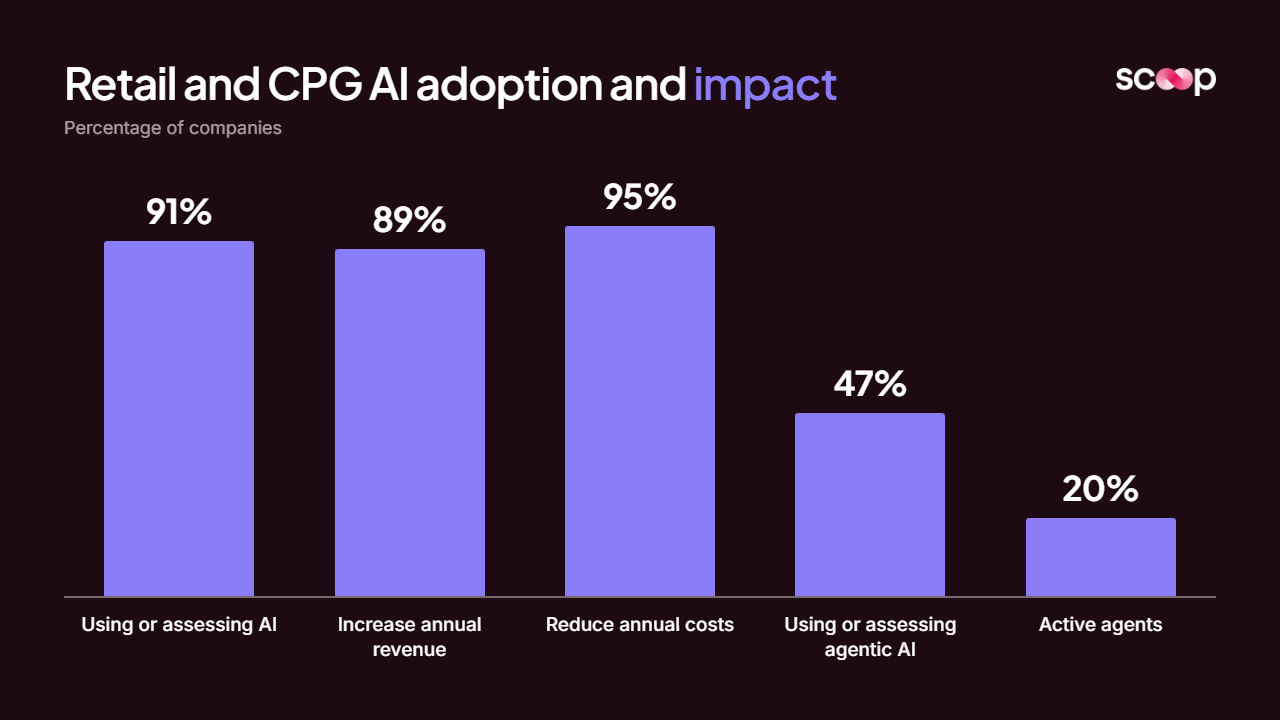
Adoption is no longer the question:
- 91% of retail and CPG companies are using or assessing AI
- 89% say AI is helping increase annual revenue
- 95% say AI is helping reduce annual costs
- 47% are using or assessing agentic AI, and 20% already have agents active
Decision-making is the question. A survey found more than 800 retail executives across 18 countries, found only 24% of retailers use AI for autonomous decision-making, and 85% are not yet using multi-agent systems.
Most chains have AI. Few have AI that decides where to look.
One retail operations executive estimates that store leaders now receive more than 50,000 data points per week.
More data produces a reading problem, which is why the conversation around retail analytics has shifted from access to interpretation.
The best retail AI platforms by category
No single retail AI platform covers every operational layer.
The strongest multi-location stacks combine two or three categories, each solving a different failure mode.
The newest category, built on agentic analytics, sits on top of the others rather than replacing them.
Demand forecasting and replenishment
Demand forecasting is the most mature category of retail AI.
Platforms such as Blue Yonder and RELEX apply machine learning to predict what sells, where, and when, at SKU-and-store level.
The same pattern now runs through AI in supply chain management more broadly.
What to look for:
- Forecasts at store-and-SKU grain, not just category or region
- Allocation logic across locations, not aggregate demand only
- Native POS and ERP connections, with no manual exports
- Promotion and seasonality built into the model

Store execution and compliance
Store execution platforms keep standards consistent from the first store to the five-hundredth.
Xenia is a leading example: task management, inspections, and compliance tracking in one mobile app, with AI photo analysis that checks planograms, displays, and cleanliness against the standard.
What to look for:
- Photo verification that scores against your standard, not a generic one
- Offline mobile capability for stores with weak connectivity
- Weighted checklists, so critical items count more than cosmetic ones
- Exception routing to the district manager who owns the store

Traffic analytics and loss prevention
Traffic and loss prevention platforms explain how shoppers move and where product disappears.
RetailNext uses video and POS data for people counting, path tracking, and conversion.
Sensormatic IQ focuses on shrink, inventory accuracy, and theft detection in high-risk categories.
What to look for:
- Verified customer counts that filter out staff and deliveries
- Conversion by store, by hour, and by associate where policy allows
- Shrink alerts tied to specific categories and locations
- Benchmarks against peer stores, not chain averages

Retail BI and conversational analytics
Retail BI platforms put the chain's numbers in one place, and conversational layers let people ask about them in plain English.
Datawiz ships retail data models for SKUs, promotions, and supplier hierarchies. Zenlytic and Power BI Copilot answer natural-language questions over an existing warehouse.
What to look for:
- Retail logic out of the box (comp sales, weeks of supply, basket metrics)
- Answers that cite the underlying data, so a number can be checked
- Role-based access so district managers see only their stores
- Fit with your existing BI stack rather than a parallel one

Local marketing and reputation
Local marketing platforms keep every location visible, accurate, and responsive where customers search.
Birdeye, Yext, and SOCi manage reviews, listings, and local social posts across hundreds of locations, and increasingly track how locations appear in AI search engines.
What to look for:
- One location record across listings, reviews, and messaging
- Approval workflows for AI-drafted review responses
- Visibility tracking in ChatGPT, Gemini, and Perplexity as well as Google
- Location-level marketing attribution back to visits and revenue

AI performance management
AI performance management screens every location every cycle, investigates the ones that are slipping, and delivers an action plan to the person who owns each store.
It is the category built for the COO question: which stores are in trouble, why, and what should we do about it?
What it covers:
- Every location screened automatically, not a sample someone had time to review
- Investigation of flagged stores, with root cause evidence attached
- Reports that roll up from store to district to region to the executive team
- Logic codified from your own best operator, not a generic retail model

What AI tools help regional managers spot underperforming stores?
The AI tools that spot underperforming stores are the ones that screen every location against its peers and its own history automatically, then investigate the flagged stores without waiting for someone to ask.
Dashboards, copilots, and execution apps all depend on a person choosing where to look. At scale, that choice is the bottleneck.
The math is simple:
- A district manager may carry 15 or more stores
- A chain of 1,200 stores has 1,200 weekly stories, and nobody reads all of them
- The stores that get attention are the loud ones, not the ones drifting quietly
A strategy leader at a large multi-location retailer described why diagnosis is so slow:
"When a store is doing poorly, there are literally 1000 reasons why that can be and it is usually death by 1000 cuts."
The same leader explained the cost of that slowness: by the time someone gets back with an answer, "the moment has passed to be able to action it."
That is the question behind the five-step check in why is this store down, done by hand.
AI that genuinely helps regional managers does three things:
- Screens every store, every cycle, using more than one lens (a balance check across core metrics plus leading indicators), so a store can be flagged from either angle
- Tests the usual hypotheses in parallel, such as inventory, assortment, staffing, pricing, a new competitor, or shrink, instead of one analyst working through them in sequence
- Ranks stores by severity, so the district manager walks into the right store first
Your dashboards show what happened. Scoop says what to do.
Scoop adds the diagnostic and action layer your BI tools cannot: finding what needs attention across every location, and what to do about it. Your stack stays exactly where it is.
- Sits on top of your BI
- Diagnostic and action layer
- No migration required
Why most retail AI stops at "what happened"
Most retail AI platforms are organized around how vendors build software, not around how stores fail.
Forecasting, compliance, and traffic each own one slice. A store that is slipping rarely has one-slice problems.
A typical decline combines:
- A manager change three months ago that has not reached the numbers yet
- A promotion that landed differently in one market
- A new competitor down the block
- A slow shift in which customers come back
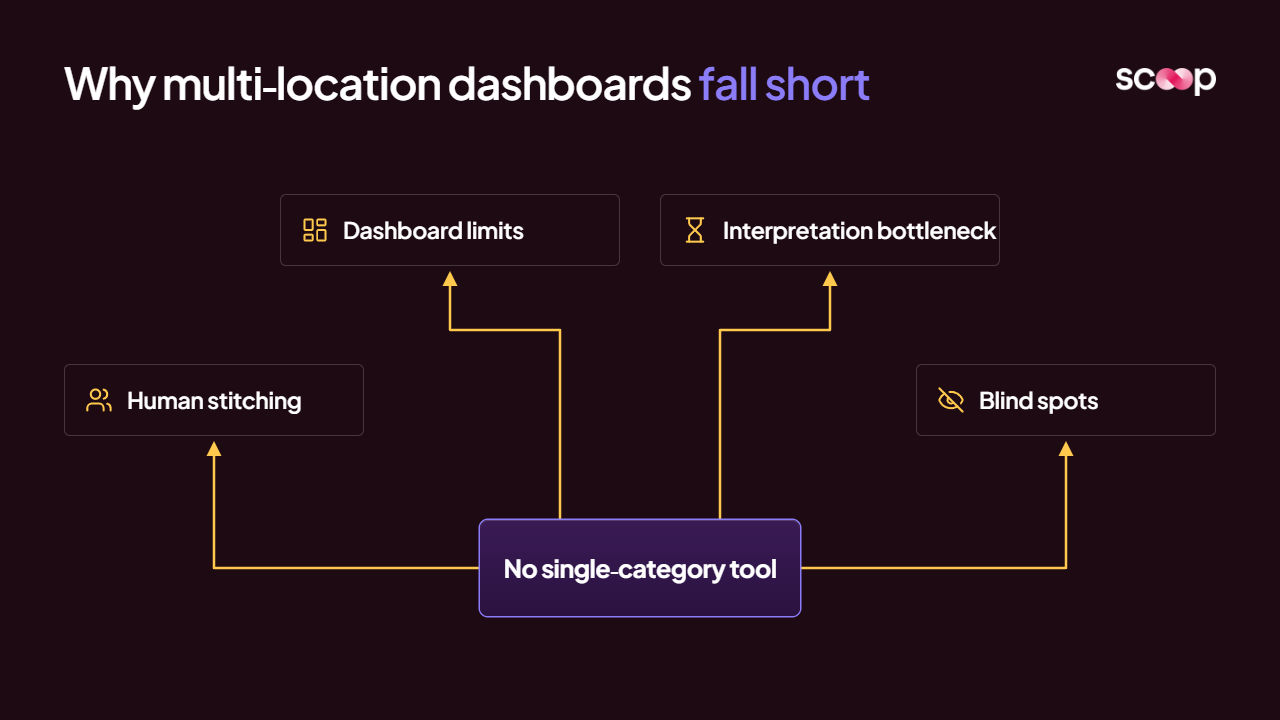
No single-category tool sees that combination. Each one reports its own metric, and a human has to stitch the story together. That is why dashboards don't work at multi-location scale: they show what happened and leave interpretation to whoever has time.
Interpretation does not scale. It sits with a few experienced operators, and it shows up as dashboard blind spots everywhere else.
It is not a data problem. It is not a tooling problem. It is a reading problem.
A retail AI pilot built on public data and generic prompts produces answers a chain's own team could have reached.
The retail strategy leader quoted above ran exactly that kind of proof of concept and concluded: "My team can do that."
How AI performance management works for retail chains
AI performance management codifies how your best operator reads the business, then runs that logic across every store, every cycle, and delivers a report with what changed, why, and what to do.
It is not AI let loose on your data. It works inside a structure, sometimes called a harness, built from your own operators' judgment.
The COO of a 1,200-location chain put the need plainly:
"There's one person in our organization who can look at these reports and see what's going to happen in six months. We have 1,200 locations. He can't get to all of them. We're trying to scale that person."
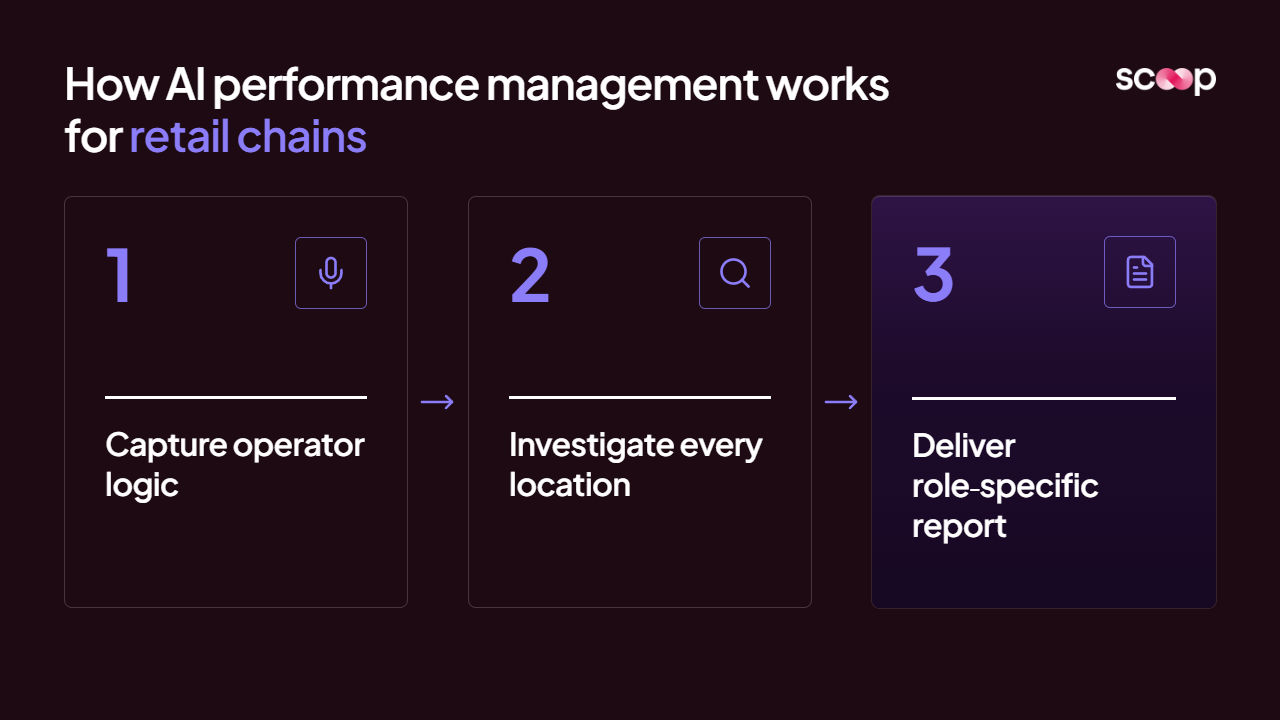
The approach runs in three stages:
- Capture the operator's interpretation logic
- Investigate every location against that logic, every cycle
- Deliver a role-specific report that rolls up the chain
What the capture step looks like
Capture starts with a hands-on session where Scoop's team sits with your operators and records how they read the reports they already use.
Brad Peters, Scoop's co-founder and CEO, describes it this way:
"If I took a tape recorder and recorded everything you thought as you looked at the BI and described your analyses, can we then stick that into the system so it could go do that on your behalf?"
What gets captured:
- What the operator checks first, and in what order
- Which thresholds matter and which movements are normal seasonality
- Which combinations of signals mean a store is about to decline
- What they would tell the store manager to do next
What the investigation does each cycle
Each cycle, the system screens every store, spawns targeted probes for the flagged ones, and uses machine learning to find drivers nobody thought to check.
This is diagnostic analytics run at fleet scale.
The sequence:
- Screening lenses run across every location: a balance check across core metrics and a leading-indicator check
- Flags trigger an investigation for any store that fails either lens
- Diagnostic probes drill into the flagged store; in one real run, 15 initial probes led the engine to spawn 3 more targeted at forecasting
- ML discovery uses decision tree learning to test every combination of dimensions (category, customer segment, transaction type, channel) and rank which one best explains the year-over-year change
- Synthesis writes the findings into a plain-language report for that store
What arrives in the report
A report arrives each cycle. Nobody logs in, builds a query, or decides where to look. Each level of the organization gets its own brief, sized for its role.
- Executive: what is systemic across the chain, framed as a decision
- Region: which districts are driving the pattern
- District: which stores are flagged, how severe, and in what order to intervene
- Store: the full investigation, root cause, ML finding, and action items
Stores are scored on a severity scale (critical, severe, normal, healthy), so attention goes where it is needed.
Because each report records the actions recommended, the next cycle can show which store fixes worked and which did not.
Live in weeks. Not months.
We connect to your data, codify your playbook, and train your team. You see a working pilot before anyone commits to a full rollout.
- Connect your data
- Codify your playbook
- Pilot before rollout
How to choose an AI platform for retail operations
Choose the platform that fixes your most expensive failure mode, then test it on your own data before you commit.
A feature checklist will not separate vendors:
What is your most painful failure mode?
Stockouts point to forecasting. Inconsistent execution points to compliance tools. Stores quietly declining without anyone catching it early points to AI performance management.
Does it cover every location?
If someone still decides which stores to review, you have a coverage problem, not a data problem.
Does it sit on your existing stack?
Look for read-only connections to POS, ERP, WMS, and your warehouse, with no migration and no parallel BI.
What arrives at the end?
Ask for a sample output. A report that says "monitor performance" is not an action plan.
Is it governed for enterprise use?
Require role-based access, SSO, and SOC 2 Type II attestation, so a district manager sees only their stores.
Can it run where your licensed data lives?
Third-party traffic and panel data often cannot leave your environment. Deployment inside your own cloud solves that without renegotiating every contract.
How fast is a working pilot?
Weeks, not quarters. Scoop's implementation runs from kickoff to a live pilot in about four weeks.
Checklist overview:
What is the business case for multi-location retail AI?
The business case is more from less: more stores covered, more problems caught early, without adding district managers or analysts.
Where the value shows up:
- Coverage: every store reviewed every cycle, not the handful someone had time for
- Speed: diagnosis in the same week, while the moment can still be acted on
- Consistency: the same expert logic applied in Phoenix and in Philadelphia
- Capacity: analysts move from "what happened" to "so what" and "now what"
Catch the store problem before it hits the P\&L.
Scoop screens every store, every cycle, for comp sales, conversion, labor, and inventory issues. Then it sends the action plan straight to the manager who owns the fix.
- Comp sales and conversion
- Labor and inventory
- Every store, every cycle
Why Scoop is the best retail AI platform
Forecasting reduces stockouts. Compliance tools keep stores consistent. Traffic analytics explain conversion.
None of it answers the question that keeps a COO up at night: which of my stores is slipping, why, and what do we do this week?
That takes investigation. Not monitoring. Not another dashboard.
Your best operator's judgment, running on every store, every cycle. That is the layer Scoop Analytics adds on top of everything else in the stack.
Codify what your best operators already know.
Scoop captures your operators' tribal knowledge, screens every location automatically, and delivers role-specific action plans. Nobody writes a prompt. The plan just arrives.
- Codified tribal knowledge
- Automatic screening
- Action plans, not dashboards
Frequently asked questions about the best retail AI platforms
What is the best AI platform for multi-location retail?
There is no single best platform; there is a best platform per failure mode. Blue Yonder and RELEX are established names in forecasting, Xenia in store execution, RetailNext in traffic analytics, and Birdeye in local marketing. For diagnosing why individual stores underperform, Scoop adds an AI performance management layer on top of all of them.
How can district managers use AI to oversee multiple stores?
District managers use AI to replace manual report reading with automatic screening. The system flags which stores need attention, explains why, and ranks them by severity, so store visits start with a diagnosis rather than a hunt. The five-step store check a good district manager runs by hand is what the AI runs on every store.
Does a retail AI platform replace Power BI or Tableau?
No. Forecasting, execution, and performance management platforms all read from your existing systems. Scoop specifically adds the diagnostic and action layer on top of Power BI, Tableau, Excel, or a warehouse. Nothing gets ripped out.
How long does it take to implement retail AI?
Execution vendors such as Xenia report rollouts of one to two weeks. Forecasting platforms usually take longer because they plug into replenishment and planning systems. AI performance management typically reaches a working pilot in about four weeks, because it reads data you already have and Scoop's implementation process centers on capturing your operators' logic.
Which retail AI platforms work for 5 to 50 locations?
Smaller chains usually start with execution and compliance tools, which price per user or per location. Diagnosis becomes urgent once a chain outgrows one person's ability to review every store each week. The cost of location variance grows with every store added.
What is the difference between retail analytics for retailers and for CPG brands?
Retailer platforms analyze the chain's own stores, staff, and P&L. CPG platforms such as Alloy.ai and Crisp analyze how a brand's products sell through other retailers' stores. A multi-location operator needs the first kind, the focus of retail analytics for operations leaders.
Is retail AI replacing store managers or district managers?
No. The strongest implementations scale the judgment of experienced operators rather than replacing it. The AI handles the legwork of reading every report, so managers spend their time on the decisions only people can make. It is human-in-the-loop AI by design.
Get insights like this every week
Analytics, ops strategy, and product updates. No noise.
Keep reading
What Is Tribal Knowledge in Multi-Location Operations?

What is retail analytics? A guide for leaders running multi-location chains
Why Multi-Location Businesses Lose Operational Knowledge Every Time Someone Leaves
Book a discovery call
Reach out to start a two-way conversation about your industry, your performance variations across locations, and whether Scoop is the right fit for you.