
What is retail analytics? A guide for leaders running multi-location chains
Retail analytics explained: the four types, the data behind them, the KPIs that matter, and why multi-location chains stall at store diagnosis.

What is retail analytics? Types, KPIs, and store diagnosis
Retail analytics is the practice of collecting and analyzing data from POS systems, inventory, supply chain, labor, and customer channels to explain store performance and decide what to do next. It runs on four levels:
- Descriptive (what happened)
- Diagnostic (why)
- Predictive (what's next)
- Prescriptive (what to do)
You have the dashboard. It says comp sales are down 4% in the Northeast. Do you know why?
Usually, that number sets off a chain of follow-ups:
- A message to the regional VP
- A request to the BI team for a cut by store, category, and week
- A district manager visit to the three worst stores
By the time the answer comes back (a stockout, a new competitor down the block, a store manager who quit), the window to act has often closed.
This guide covers:
- What retail analytics does for a chain with hundreds of stores
- Where retail analytics stalls
- What AI performance management adds to your efforts
Built for the businesses that run everywhere at once.
Scoop exists to bring best-in-class operational diagnostics to every distributed business, not just the ones big enough to staff a team for it. Meet the people building it.
- Operator-first by design
- Built for distributed teams
- Diagnostics, not dashboards
What is retail analytics?
Retail analytics is the use of store, digital, and supply chain data to measure performance and guide decisions on inventory, pricing, labor, merchandising, and store operations.
It’s a software used to collect and analyze data from physical, online, and catalog outlets so retailers can understand customer behavior and shopping trends.
The retail analytics market is valued at USD 11.31 billion in 2026 and is projected to reach USD 20.65 billion by 2031.
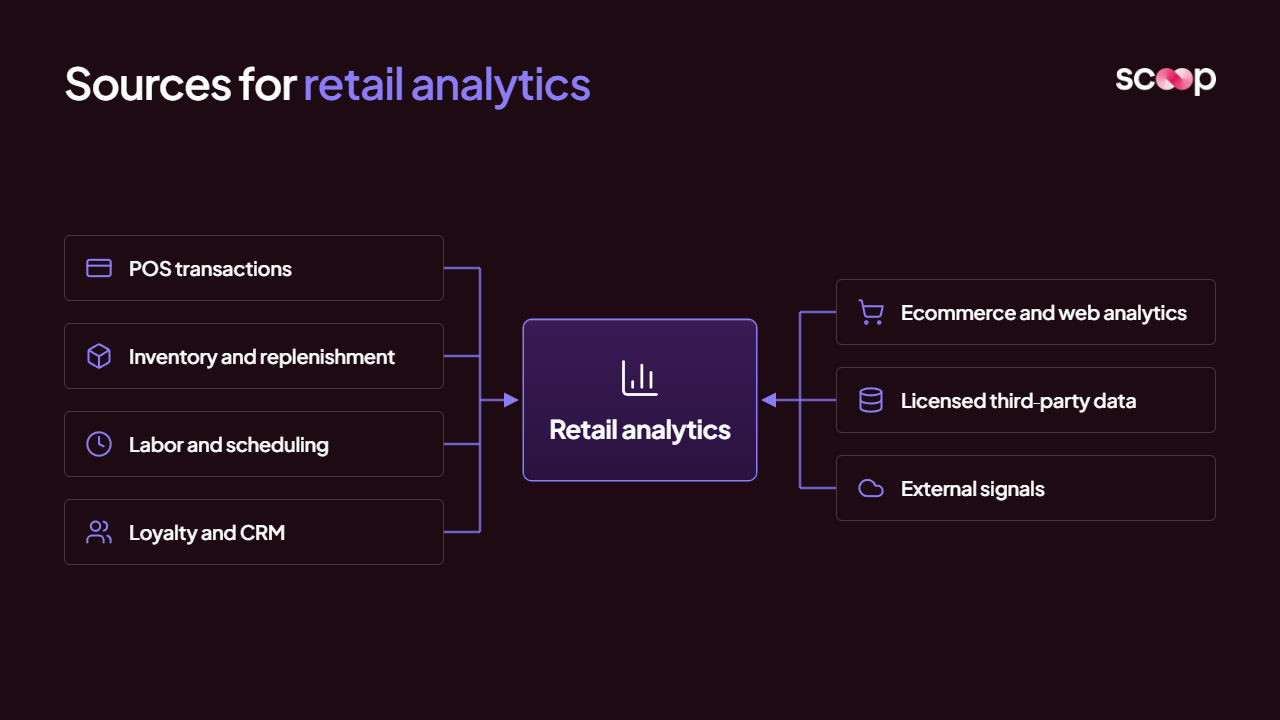
A mature retail analytics program pulls from these sources:
- POS transactions: units, tickets, discounts, returns, and tender by store and hour
- Inventory and replenishment: on-hand, in-transit, aged stock, and size or price-point gaps
- Labor and scheduling: hours, floor coverage, overtime, and turnover
- Loyalty and CRM: repeat rate, segment mix, and lapsed customers
- Ecommerce and web analytics: traffic, conversion, and buy-online-pick-up-in-store volume
- Licensed third-party data: market share and foot traffic from providers like Circana and Nielsen, usually under strict licensing terms
- External signals: weather, local events, and competitor openings
What are the four types of retail analytics?
There are four types of retail analytics: descriptive, diagnostic, predictive, and prescriptive.
Each answers a harder question than the one before it, and each depends on the one before it being right.
Here is how each type shows up in practice:
- Descriptive analytics is where most dashboards live: sales, traffic, inventory, and labor, sliced by store and week.
- Diagnostic analytics finds the root cause behind a moving number.
- Predictive analytics uses historical data and statistical models to forecast demand, sales, and staffing needs.
- Prescriptive analytics recommends the next move.
Catch the store problem before it hits the P\&L.
Scoop screens every store, every cycle, for comp sales, conversion, labor, and inventory issues. Then it sends the action plan straight to the manager who owns the fix.
- Comp sales and conversion
- Labor and inventory
- Every store, every cycle
Which retail KPIs matter at the executive level?
A COO reviewing a multi-location chain needs a short set of retail KPIs that connect store activity to margin.
These are the ones that show up in almost every executive operating review:
- Comp sales (same-store sales): revenue growth for stores open at least a year, which strips out new openings
- Sell-through rate: units sold divided by units received in a period
- GMROI: gross margin dollars earned for every dollar of average inventory cost
- Inventory turns: how many times inventory sells through in a year (inventory turnover)
- Shrink as a % of sales: inventory lost to theft, damage, and administrative error
- Labor as a % of sales: payroll cost relative to revenue, by store and daypart
- Conversion rate: transactions divided by store traffic
- Average transaction value: revenue per ticket
Every one of these KPIs tells you what moved. None of them tells you why.
The real executive question is variance
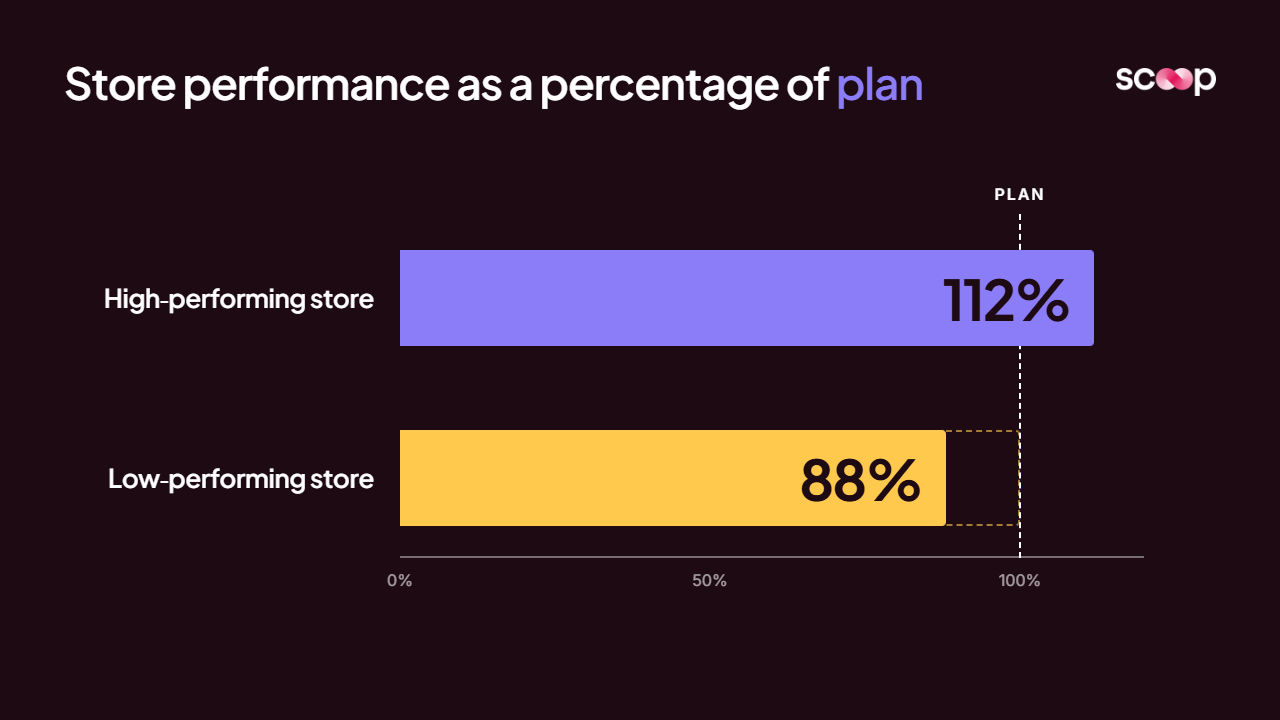
Why does one store run at 112% of plan while a store 20 miles away, with the same format and the same assortment, runs at 88%?
Understanding the cost of location performance variance changes how a chain decides where to spend district manager time.
A raw ranking puts high-traffic urban stores on top and rural stores on the bottom every week. To benchmark locations against each other properly, you need peer groups based on format, traffic, and market, not a single league table.
Why does retail analytics break down across hundreds of stores?
Retail analytics breaks down at scale because diagnosis is still manual.
The data is there and the dashboards are there. What doesn't scale is the person who reads them and works out why.
A strategy leader at a multi-location retailer described the problem in a conversation with Scoop:
"When a store is doing poorly, there are literally 1,000 reasons why that can be. It is usually death by 1,000 cuts."
His point, captured in a retail strategy leadership lesson is that most of those reasons collapse into roughly 10 primary hypotheses. He listed them:
- Did the inventory arrive late, or arrive short at certain price points?
- Is it an assortment problem?
- Is it a traffic problem, and is it worse than in similar stores?
- Is the store manager new, or getting poor reviews?
- Are there staffing gaps?
- Is shrink unusually high?
- Did someone change the pricing?
- Is there a new competitor down the block?
- Did we change the plan and do this to ourselves?
Testing the arithmetic
Ten hypotheses across 500 stores is 5,000 checks every week. No regional team runs that.
So the weekly review covers the top 10 and the bottom 10, and the stores costing you margin are the ones in the middle that nobody gets to.
Even when a store does get looked at, the timing works against you.
By the time someone is able to get back to them, the moment has passed.
Running a disciplined five step check on a struggling store works. It just doesn't work 500 times a week.
The cost shows up in inventory
IHL Group's 2025 research on inventory distortion estimates that internal inefficiencies alone cost retailers nearly $500 billion, separate from supplier missteps and theft.
Codify what your best operators already know.
Scoop captures your operators' tribal knowledge, screens every location automatically, and delivers role-specific action plans. Nobody writes a prompt. The plan just arrives.
- Codified tribal knowledge
- Automatic screening
- Action plans, not dashboards
How is AI changing retail analytics in 2026?
AI is moving retail analytics from "ask a question" to "get told what needs attention", but most retailers are still early.
A survey of more than 800 retail executives showed:
- Only 24% use AI for autonomous decision-making
- 51% say chatbots and virtual assistants are their leading AI initiative
- The largest economic impact of AI lies in operations
There are two very different models of AI in retail analytics:
The ask model:
Imagine a chat window on top of your dashboards, someone types "why are sales down in the Northeast?" and gets a summary. It is faster, but someone still has to know which question to ask, for which store, this week.
The told model:
An investigation runs across every store every cycle, tests the hypotheses, and reports what changed, why, and what to do.
Investigation is harder than it looks
Dashboard summaries are easy, investigation is harder.
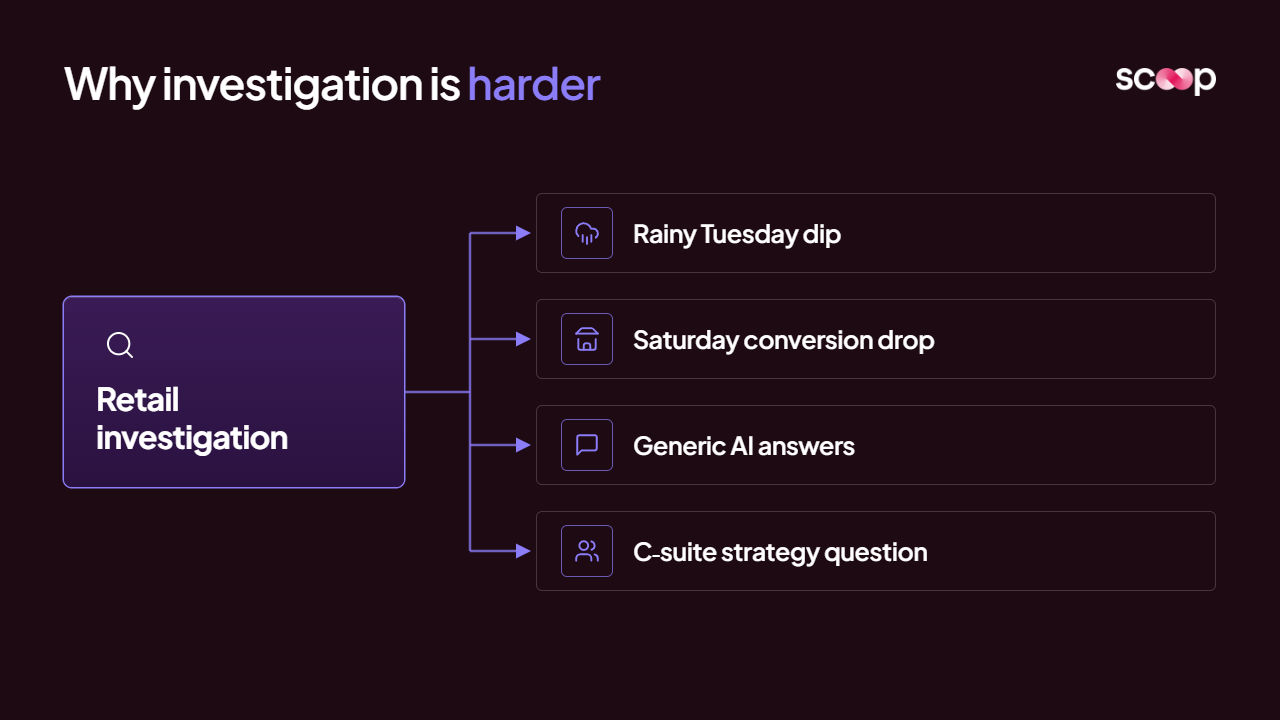
A model that summarizes a chart doesn't know that a 4% traffic dip on a rainy Tuesday is normal, but a conversion drop on a high-traffic Saturday is a staffing problem.
The same retail strategy leader learned this firsthand. His team tested a generic AI consulting service on public data and concluded:
"My team can do that. There is no incremental value here."
Generic AI without the business's own context produced answers his people already had.
This is why AI decision management is becoming a strategy question for the C-suite rather than a tooling question for IT.
What does AI performance management add on top of retail BI?
AI performance management adds the interpretation and action layer that retail BI doesn't provide.
It codifies how your best operators read the business, screens every store every cycle, and delivers a role-specific action plan with the evidence behind each conclusion.
Scoop sits on top of the Power BI, Tableau, warehouse, POS, and inventory systems a chain already runs.
In practice, retail performance management with Scoop means:
- Every store is screened for comp sales, conversion, labor, and inventory issues every cycle
- Flagged stores are investigated, not just ranked
- Standards are monitored for adherence, which addresses the drift problem in retail: the plan was right, but execution slid store by store
Find the daypart gap before the week closes.
Scoop identifies daypart gaps, labor inefficiency, and food cost issues across every location, every cycle. Then it tells each manager exactly what to do about it.
- Daypart gaps
- Labor and food cost
- Manager-ready actions
How does Scoop capture your best operator's judgment?
Scoop's team sits with your operators during setup and captures how they read the business.
Brad Peters, Scoop's co-founder and CEO, describes it plainly:
"If we took a tape recorder and recorded everything you thought as you looked at your BI reports, we stick that into the system so it can do that on your behalf."
The capture process looks like this:
- Scoop sits with the COO, regional VPs, and the strongest district managers
- They walk through the reports they already use, week by week
- Scoop records what they check first, which thresholds matter, and which signals they act on versus ignore
- That logic becomes the screening lenses and diagnostic probes that run across every store
What happens every cycle?
Once setup is complete, the investigation runs on its own and a report arrives. Nobody logs in or builds a query. The cycle runs like this:
- Screen: every store is checked against the codified lenses (comp sales, conversion, labor %, aged inventory, shrink)
- Flag: stores that break a threshold or drift from their peer group are flagged
- Probe: each flagged store triggers diagnostic probes that test the likely hypotheses
- Discover: decision tree models test combinations of category, price point, daypart, and customer segment to find which ones best explain the change
- Synthesize: findings become a root cause and specific action items that reference the data
- Roll up: each level gets its own brief. The COO sees systemic issues, a regional VP sees the flagged stores in the region, and a district manager sees the store-by-store actions
You can see how Scoop works step by step, and what a read on every unit looks like when it lands.
Give every franchisee a personal ops advisor.
Scoop gives franchisors visibility into every location and gives franchisees an ops advisor of their own. Same standard, every unit, without adding corporate headcount.
- Visibility across every unit
- An advisor per franchisee
- No added headcount
Retail analytics vs business intelligence
Business intelligence shows what happened. Retail analytics with an AI performance management layer explains why and recommends what to do.
They are complementary. Business intelligence stays the system of record. The new layer sits on top of it.
Common dashboard blind spots include:
- Middle-of-the-pack stores sliding slowly, never bad enough to make the bottom 10
- Category or price-point gaps hidden inside a healthy store total
- Repeat-customer erosion that looks fine in total traffic
Scoop adds the diagnostic and action layer on top of your BI stack.
One performance view across the whole portfolio.
Scoop gives operating partners a consistent performance view across every portfolio company, finding value creation opportunities without adding overhead to the deal team.
- Consistent portfolio view
- Value creation signals
- No added overhead
How should a COO evaluate a retail analytics approach?
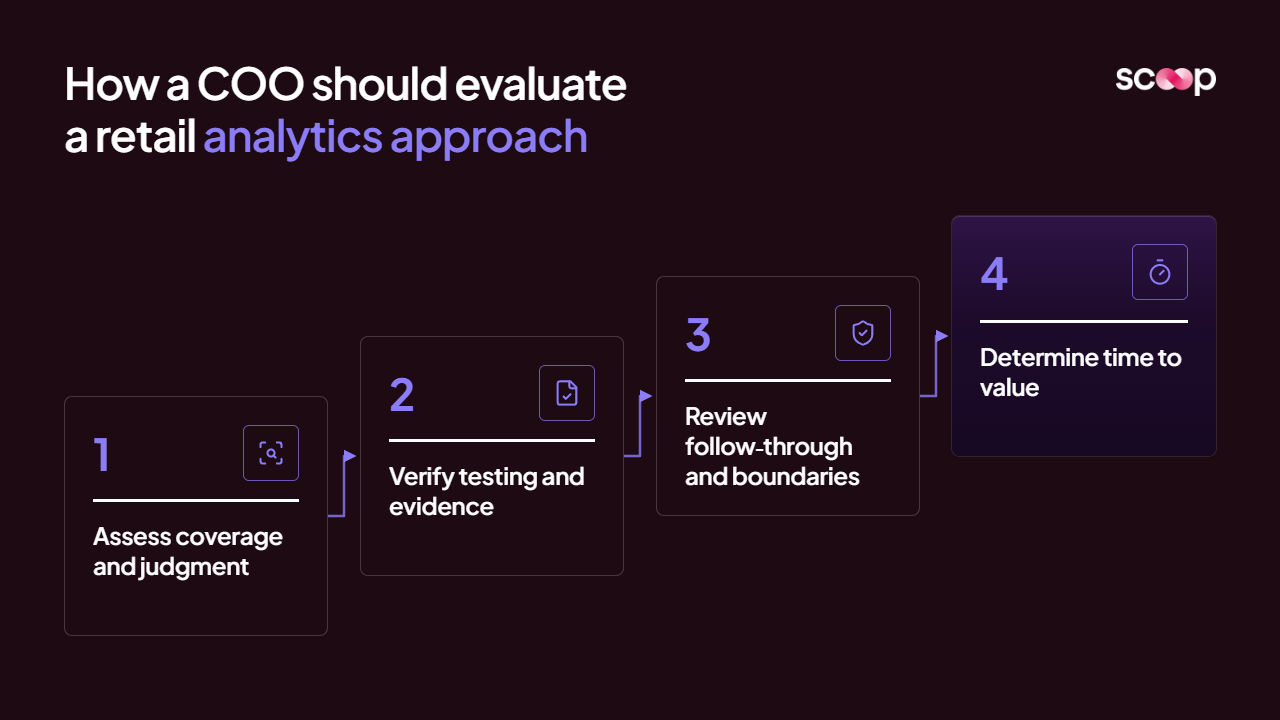
Judge a retail analytics approach by whether it changes decisions at every store, not by how good the charts look.
Ask these questions before any pilot:
- Coverage: does it look at every store every cycle, or just the ones someone thinks to check?
- Whose judgment: does it apply a generic model, or the way your operators actually read the business?
- Hypothesis testing: does it test several explanations before concluding, the way a proper root cause analysis does?
- Evidence: does every conclusion show the data behind it, so a regional VP can trust it?
- Follow-through: does it track which store fixes worked last cycle, and escalate the ones that didn't?
- Data boundaries: does licensed third-party data stay inside your environment, under your existing agreements?
- Time to value: how long until a working pilot on your own data?
A proof of concept built on public data produces answers your team already has, so it dies as "my team can do that".
Avoiding that trap is the theme of why your retail AI pilot isn't working.
Frequently asked questions about what is retail analytics?
What is the difference between retail analytics and business intelligence?
Business intelligence reports what happened, usually through dashboards. Retail analytics covers the full range, from descriptive reporting through diagnosis, forecasting, and recommendations. In practice:
- Traditional BI platforms are built for reporting and visualization
- Retail analytics adds the "why" and the "what next"
What is retail intelligence?
Retail intelligence is the ability to understand why store performance changes and act on it quickly. It combines:
- Internal data: POS, inventory, labor, and loyalty
- External context: market share, traffic, and competitors
The hard part is speed, which is why retail store diagnostics take so long without automation.
Do I need data scientists to use retail analytics?
Not for the performance-management layer. With Scoop:
- Scoop's team handles setup by sitting with your operators
- Reports arrive automatically
- Your analytics team shifts from building "what happened" reports to working on the "so what" and "now what"
Can retail analytics help with loss prevention and shrink?
Yes. Analytics can flag stores, shifts, and categories with unusual shrinkage patterns. IHL Group estimates theft cost retailers more than $500 billion in 2025. Useful signals include:
- Inventory adjustments out of line with peer stores
- Return rates that spike by shift or by associate
- Gaps between received and sold units
Anomaly detection catches these patterns early. Note that the NRF stopped publishing its annual shrink report in 2024, so older industry shrink rates are dated.
How long does it take to implement retail analytics?
Traditional data warehouse projects often take six months or more. An AI performance management layer on top of your existing stack is live in weeks, not months:
- Connect to existing data with read-only access
- Codify the playbook with your operators
- Run a working pilot before full rollout
Does retail analytics replace Power BI or Tableau?
No. Your BI tools stay in place as the reporting layer. Scoop and your BI stack work together:
- BI shows what happened
- Scoop explains why and recommends what to do
What is retail operational intelligence?
Retail operational intelligence applies operational analytics to store execution. It focuses on:
- Adherence to standards across every location
- Labor and inventory execution
- Store-level variance against peer groups
The goal is to catch drift before it shows up in the P&L.
Get insights like this every week
Analytics, ops strategy, and product updates. No noise.
Keep reading

Why retail AI analytics pilots fail (and how to fix them)

AI Retail Analytics: Multi-Location's Guide to Weekly Store Investigations
What Are Two Ways That Data Analytics Benefits Retailers?
Book a discovery call
Reach out to start a two-way conversation about your industry, your performance variations across locations, and whether Scoop is the right fit for you.