
Which Analytics Platform is Best for B2B Hospitality?
Compare the top hospitality analytics platforms for 2026: financial BI, revenue intelligence, F&B, and the AI layer that explains why the numbers moved.
Best Hospitality Analytics Platforms for B2B in 2026
Ask a hotel group with a dozen dashboards one simple question: "Why is our weekend occupancy down 15% compared to last year?"
Most cannot answer it by Monday.
The data is not the problem. The numbers already sit in systems every operator owns:
- A property management system (PMS) for reservations and rates
- Point-of-sale (POS) records for restaurants, bars, and events
- CRM and loyalty profiles
- Accounting and labor data
- Competitive benchmarking reports
The gap is the "last mile": the step between having a report and taking a profitable action. That gap is why dashboards don't work once a portfolio outgrows the few people who know how to read them.
The pressure also moved in 2026. U.S. hotel RevPAR fell 0.3% in 2025, the first non-recessionary decline on record. The 2026 outlook has since been raised to RevPAR growth of 4.4%. But CoStar and Tourism Economics expect expenses to rise faster than inflation in both 2026 and 2027, with GOPPAR growth slowing from 4% this year to 1% next year.
Revenue recovered. Margin is where the questions are now.
What is a B2B hospitality analytics platform?
A hospitality analytics platform is software that pulls data from property management, point-of-sale, accounting, and labor systems into one view of business performance. "B2B" signals the buyer: owners, operators, management companies, and franchise groups measuring the business itself, not guest-facing apps.
Unlike a general-purpose data analytics platform, a hospitality platform ships with the industry's own KPIs:
- RevPAR (revenue per available room)
- ADR (average daily rate)
- GOPPAR (gross operating profit per available room)
- TRevPAR (total revenue per available room)
- CPOR (cost per occupied room)
- Labor cost % and table turnover for F&B
Knowing the KPI is the easy part. Knowing why it moved is not.
How does an analytics platform work in a hospitality setting?
A hospitality analytics platform works as a translator. It pulls raw data out of separate systems (say, a restaurant's Square POS and a hotel's Mews PMS), cleans it, and organizes it into an integrated data platform that serves as one source of truth.
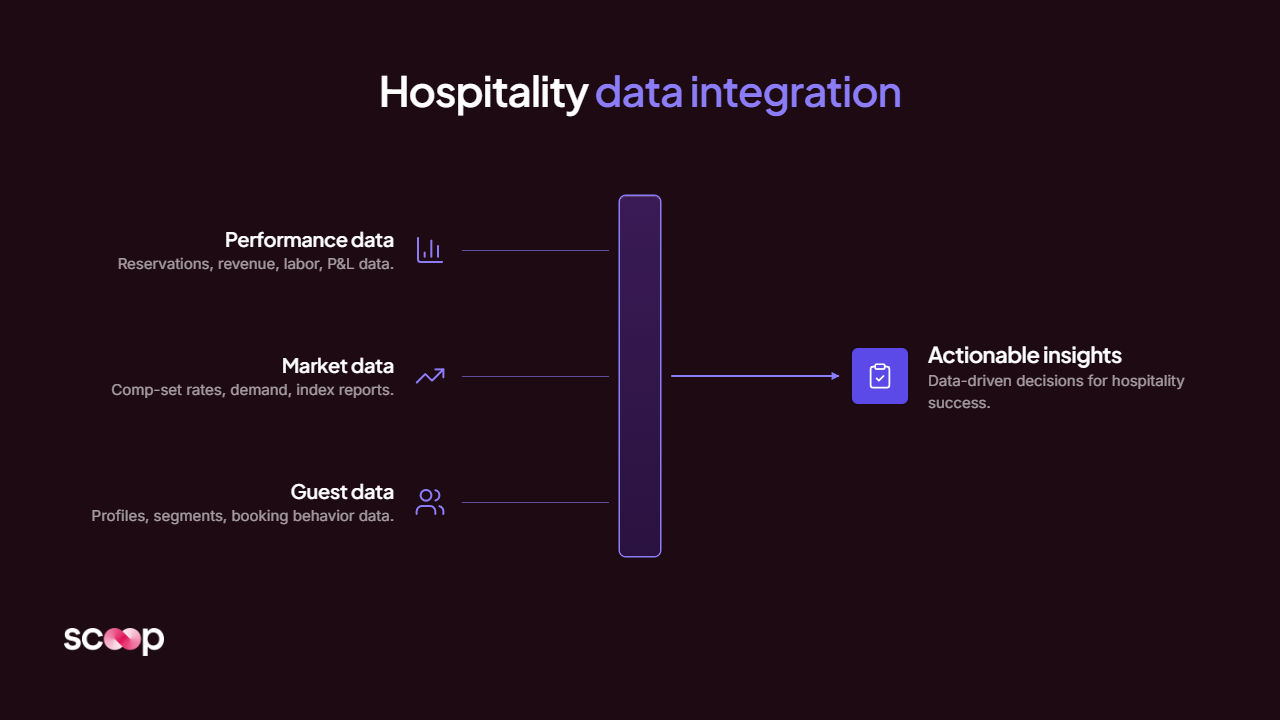
Three kinds of data feed it:
- Performance data. Reservations, revenue, labor, and P&L lines from the PMS, POS, and accounting system.
- Market and benchmarking data. Comp-set rates, demand, and index reports from providers such as STR.
- Guest data. Profiles, segments, and booking behavior from the CRM and booking engine.
From there, rule-based logic or machine learning spots trends. The platform might flag that high-value loyalty members book less often in shoulder season.
That is where most platforms stop. They report the pattern. A person still has to decide what it means.
Which analytics platforms lead B2B hospitality in 2026?
No single platform wins every layer. The 2026 market splits into five layers, and most multi-property operators run two or three of them at once:
- Financial and operational BI
- Revenue and market intelligence
- F&B and restaurant analytics
- Digital journey and enterprise data
- AI performance management
The same split runs through hotel industry analytics software in general: each tool answers one department's questions well. The right choice depends on which question is still open.
1. Financial and operational BI: M3, Otelier, and Actabl
This layer answers one question: where does each property stand on the P&L? It is the backbone for owners and management companies that run on hotel financial analytics.
- M3. Hotel-specific accounting and BI serving more than 9,000 hospitality properties. A Blackstone Growth portfolio company, M3 has AI live across invoice processing and bank reconciliation. Its Insight tool combines financial, labor, and STR benchmarking data in one dashboard.
- Otelier. Formerly MyDigitalOffice (MDO). The company rebranded as Otelier in 2024 and launched IntelliSight, a BI platform that aggregates cross-functional data for a single hotel or a full portfolio.
- Actabl. One platform that brings together ProfitSword (BI), Hotel Effectiveness (labor), ALICE (operations), and Transcendent (asset management).
Best for: Hotel owners and management companies focused on bottom-line profitability.
The limit: These tools show which line moved. They do not say why, or what the GM should do about it.
2. Revenue and market intelligence: Lighthouse, Duetto, and STR
This layer answers a different question: how is each property priced and positioned against its market? It supports revenue intelligence, demand forecasting, and pricing optimization.
- Lighthouse. Formerly OTA Insight. Rate shopping, market insight, and a BI product whose generative AI Smart Summaries send daily performance summaries to commercial teams.
- Duetto. Revenue management built around dynamic pricing and demand forecasting.
- STR (CoStar). The standard benchmark for occupancy, ADR, and RevPAR against a competitive set.
Best for: Revenue managers and commercial leaders.
The limit: Revenue tools stop at the top line. As the CEO of an independent hotel management group put it: "No one in the market benchmarks operational costs (labor, energy) against occupancy. It's all revenue."
3. F&B and restaurant analytics: Restaurant365 and Restroworks
General hotel BI feels clunky inside a restaurant. This layer covers the kitchen-to-CFO pipeline for multi-unit food and beverage operators, a category G2 tracks as restaurant business intelligence.
- Restaurant365. Accounting-first, with inventory and scheduling for multi-entity restaurant groups.
- Restroworks. A unified platform that spans POS, inventory, kitchen automation, and restaurant analytics.
Best for: Restaurant groups, enterprise food service, and hotel F&B departments.
The limit: Strong on food cost and labor by unit. Not built to explain why one unit drifts away from the rest.
4. Digital journey and enterprise data: Amplitude, Mitzu, and Solix
This layer answers questions about guest behavior and data infrastructure, not property operations.
- Amplitude and Mitzu. Product analytics for OTAs, airlines, and hotel brands with heavy app and web booking traffic. Amplitude tracks behavior across the digital journey. Mitzu is warehouse-native: it queries Snowflake or BigQuery directly instead of copying data out.
- Solix. Enterprise data management and archiving for large chains that need governed, AI-ready data across active and inactive systems.
- Suite-native BI. Oracle OPERA Cloud Reporting and Analytics and Infor Hospitality Analytics and Insights report directly on each vendor's own hospitality data.
Best for: Marketing and product leaders (Amplitude, Mitzu). CIOs and data teams at large chains (Solix, Oracle, Infor).
The limit: These are foundations. They hold and visualize data. A digital analytics platform leaves the interpretation to the reader.
5. AI performance management: Scoop
AI performance management is the layer on top of the other four. It does not replace the PMS, the accounting system, or the BI tool. It reads them the way your best operator would.
Scoop is built for hospitality performance management across a portfolio:
- Screens every property, every cycle. Not only the four or five that usually get the scrutiny.
- Diagnoses the driver. A RevPAR decline can come from ADR, occupancy, channel mix, or labor cost. Each one needs a different response.
- Delivers a report. Each regional VP and GM receives what changed, why, and what to do. Nobody builds a query.
- Sits on the existing stack. Scoop adds the interpretation and action layer to your BI stack: Power BI, Tableau, a warehouse, or scheduled extracts.
Best for: COOs and operations leaders of multi-property groups that already have BI and still cannot say why a property moved.
The limit: It needs a data foundation to read. Without one, the first step is an initial engagement with Scoop to get the plumbing in place.
Comparison of leading hospitality analytics platforms
The five layers answer five different questions. The first four are forms of reporting, from accounting dashboards to a full business intelligence platform. Only the fifth interprets.
How do I choose the right platform for my operations?
Choose by the question you cannot answer today, not by the feature list. The cost of a wrong pick is not the subscription. It is the hours a team spends forcing a generic tool to understand hospitality logic.
A platform that demos well can still fail in month three, when the sample data is gone and your own rate codes, PMS exports, and chart of accounts arrive.
Three signals that a hospitality analytics platform fits:
- It speaks hospitality natively: USALI-style P&L lines, rate plans, comp sets.
- It connects to your systems of record without a migration.
- Someone outside the data team can act on its output.
Five steps for selecting a hospitality analytics platform
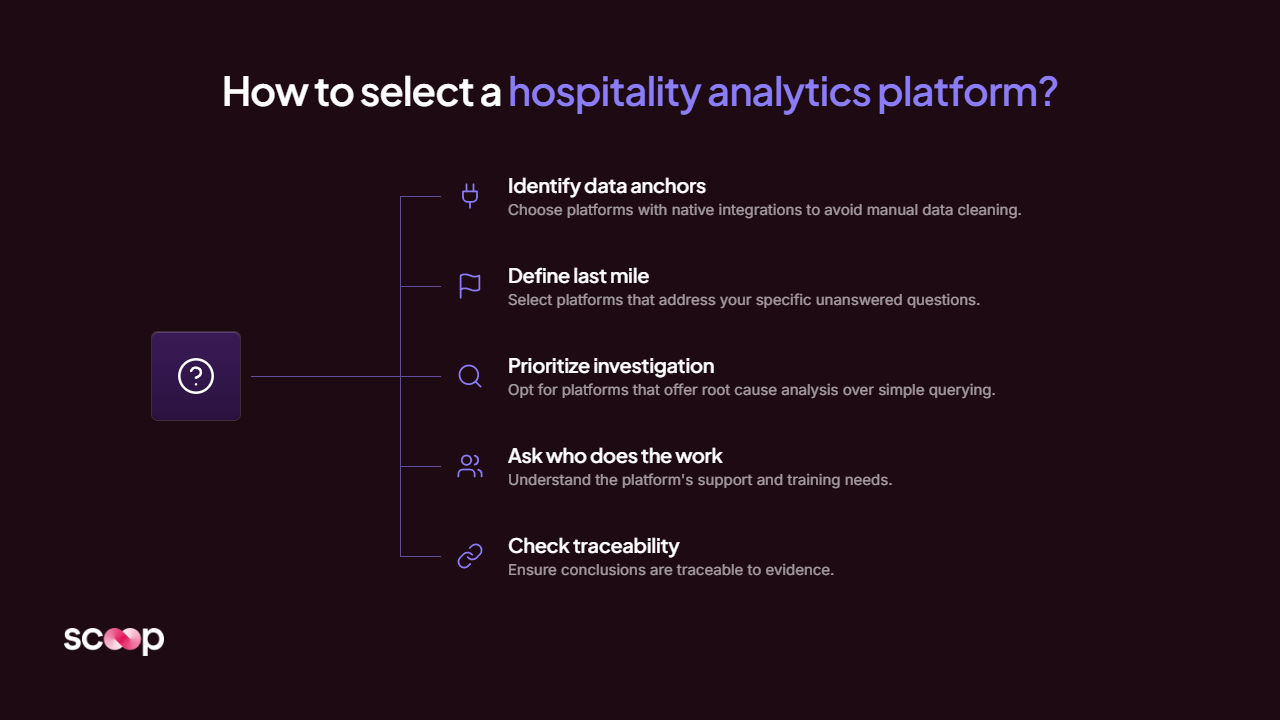
- Identify your data anchors. What is your system of record? If you run Mews for PMS or M3 for accounting, favor platforms with native integrations to avoid manual data cleaning.
- Define your last mile. What is the one question you cannot answer right now? "Which channel has the highest guest lifetime value?" points to digital analytics. "Why is food waste so high at three units?" points to F&B analytics. "Why did GOP fall at properties where RevPAR grew?" points to the interpretation layer.
- Prioritize investigation over querying. Most platforms let you query what happened. Few run a root cause analysis on why it happened. AI-written dashboard summaries are not an investigation.
- Ask who does the work. Some tools need engineering support to build and maintain. Some need every GM trained on a new interface. Others arrive as a finished report. Know which one you are buying.
- Check that conclusions are traceable. "GenAI" on a feature list is not enough. Look for approaches such as neuro-symbolic AI that pair language models with deterministic logic, so every finding points back to evidence. Operators will not act on an answer you can't reproduce.
How does AI performance management work on top of hospitality BI?
It codifies how your best operator reads the reports, then runs that reading across every property, every cycle. BI shows what happened. AI performance management tells you what it means and what to do next.
The capture step is concrete. Scoop's founder and CEO, Brad Peters, describes it this way:
"If I took a tape recorder and recorded everything you thought as you looked at your BI reports, we stick that into the system so it could do that on your behalf."
Scoop's team sits with your COO, regional VPs, and longest-tenured GMs and records how they interpret the numbers: what they check first, which thresholds matter, which signals they ignore. That tribal knowledge becomes the logic the system runs.
From there, how Scoop works follows a fixed sequence:
- Screening. Every property is screened on a regular schedule for year-over-year deviations, ratio imbalances, and early warning indicators.
- Flag and spawn. When a screen trips, the system spawns an investigation into that property.
- Probes. Each investigation runs 15 to 30 probes: defined metric-by-attribute analyses with rules for how to interpret them.
- ML decision-tree analysis. A decision tree model compares 10 to 20 variables at once against a healthier prior period and isolates the statistically significant differences.
- Synthesis and roll-up. Findings are synthesized per property, then rolled up from property to region to portfolio. Each role sees its own view.
Then a report arrives. Nobody logs in to anything.
In hospitality, the probes test what a veteran operator checks by instinct:
- Housekeeping labor against occupancy. One operator benchmark for a midscale limited-service hotel: an 8-hour shift cleans about 12.5 rooms.
- Energy cost per occupied room. AC left running in unoccupied rooms is a classic leak.
- OTA share of room nights. Compared against direct-booking peers at similar occupancy and ADR.
The model is already running outside hotels. At the largest second-hand retail chain in the United States, with roughly 1,200 stores, Scoop's team recorded how senior managers read their Power BI reports. That logic now runs across every store, so junior staff catch patterns a 20-year veteran would catch.
Why does this matter? Because standards drift. The CEO of an independent hotel management group described pushing a best practice to his properties and watching "things unravel" five days later. His ask was simple:
"Put a success system in a box."CEO, independent hotel management group
Every location diagnosed. Every cycle.
Scoop is AI performance management for distributed businesses. It diagnoses performance at every location, every cycle, and hands every manager a clear action plan.
- Every location, every cycle
- Role-specific action plans
- No prompting required
Which platform should you choose?
The best platform is the one your team acts on every Tuesday morning. Match it to the question that is still open:
- The P&L is unclear: M3, Otelier, or Actabl.
- Pricing and comp-set position are unclear: Lighthouse, Duetto, or STR.
- The restaurants are the question: Restaurant365 or Restroworks.
- The reports exist and nobody can say what they mean: AI performance management.
Everyone is being asked for more from less. Data exists. BI exists. Interpretation is the layer that does not scale on its own.
Not the chart. Not the click. The interpretation.
Built for the businesses that run everywhere at once.
Scoop exists to bring best-in-class operational diagnostics to every distributed business, not just the ones big enough to staff a team for it. Meet the people building it.
- Operator-first by design
- Built for distributed teams
- Diagnostics, not dashboards
Frequently Asked Questions about which analytics platform is best for B2B hospitality
What is the "last mile problem" in hospitality BI?
The last mile problem is the gap between a dashboard and a business action. Most tools provide the "what" (occupancy is down). Few provide the "why" or the fix in language a busy operations leader can act on. Closing the last mile of business intelligence takes interpretation, not another chart.
Can an analytics platform replace my data team?
No. It changes what the team does. A modern platform automates data cleaning, report generation, and basic trend spotting. Asking whether AI will replace business intelligence roles misses the point. The analyst who was "keeping their head above water" gets time for the "so what" and the "now what." You do not lose them. You 10x them.
How does "warehouse-native" analytics benefit my hotel?
Warehouse-native tools such as Mitzu query your existing data warehouse directly. You do not pay for a second storage layer, your data stays under your own security controls, and every team works from one source of truth. It is the cloud analytics model without copying data out. Scoop takes the same stance at the interpretation layer: built on your data, not ours.
What is the best analytics platform for hotel chains and multi-property operators?
For hotel chains and multi-property operators, the strongest setup is a financial BI platform (M3, Otelier, or Actabl) with an interpretation layer on top. BI standardizes reporting across the portfolio. AI performance management screens every property each cycle and flags the ones that are drifting. Scoop's implementation runs in weeks: connect the data, codify the playbook, run a working pilot.
What are the best tools for hospitality financial analytics?
M3, Otelier, and ProfitSword by Actabl are the leading hotel-specific options. All three automate financial reporting across properties: P&L, budgets, forecasts, and labor. Restaurant365 plays the same role for restaurant groups.
ProfitSword vs OTA Insight vs MDO: which hotel BI tool is which today?
All three now carry a new name or a new parent. Among hotel business intelligence tools:
- ProfitSword is now part of Actabl (financial and operational BI).
- OTA Insight rebranded as Lighthouse (market, rate, and commercial intelligence).
- MDO (MyDigitalOffice) became Otelier in 2024 (cross-functional portfolio BI through IntelliSight).
Get insights like this every week
Analytics, ops strategy, and product updates. No noise.
Keep reading
Is It Top Analytics Software for Hotel Industry B2B?
What USALI standards reveal that QuickBooks alone won't show you
How to catch a labor scheduling problem at a hotel before it hits the P&L
Book a discovery call
Reach out to start a two-way conversation about your industry, your performance variations across locations, and whether Scoop is the right fit for you.