
Real-Time Analytics: From Fresh Data to Faster Fixes
Real-time analytics delivers data in seconds, but fixes still take weeks.
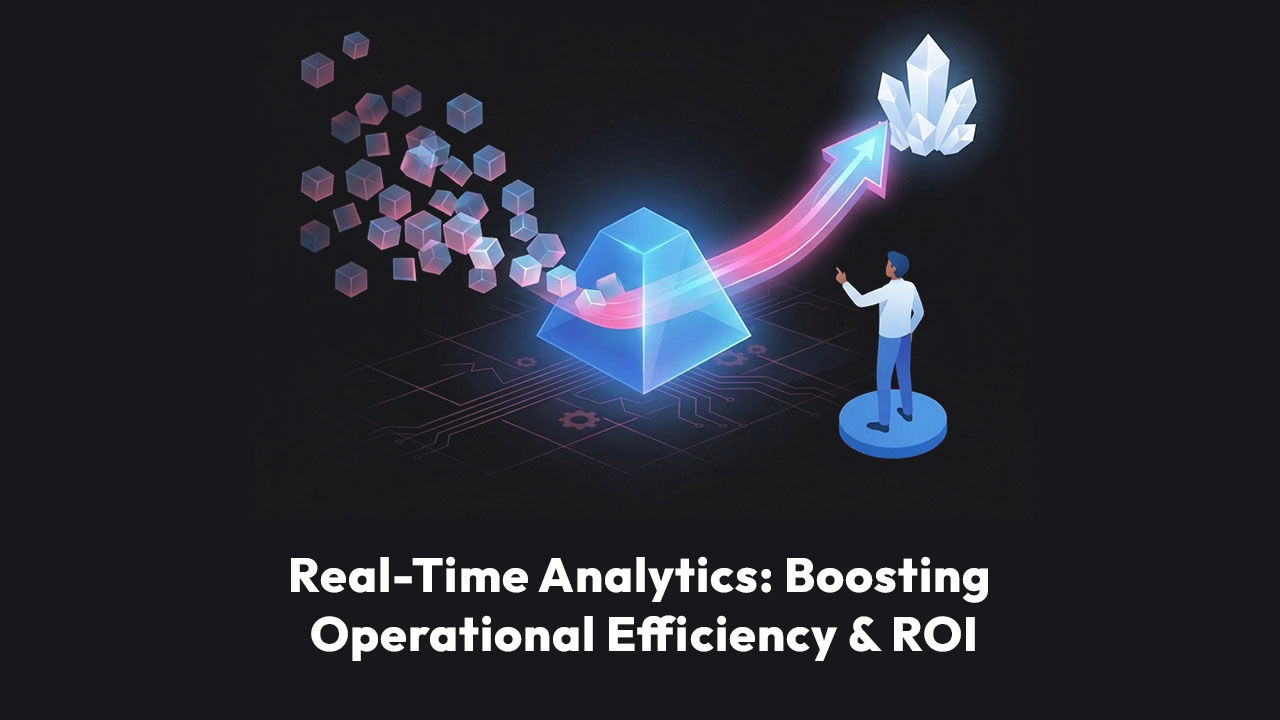
Real-Time Operations Analytics: Fresh Data, Faster Fixes
Real-time operations analytics means processing operational data as it is generated, so leaders can spot problems and act while acting still matters.
For most distributed businesses, getting the data fast is already solved. The slow part comes after the data arrives:
- Reading the signal
- Deciding what to do
- Getting the fix to the location
Kafka streams events in milliseconds. Dashboards refresh every minute. The store that started slipping on Tuesday still gets discussed at the monthly review.
The slow part is the decision.
This is the problem that AI performance management solves.
This guide covers:
- What real-time analytics is, and how fast "real-time" needs to be in operations
- Why real-time data rarely produces real-time decisions
- How the pipeline works, and where it stops helping
- How to measure whether your business actually runs in real time
- What real-time operations analytics software should deliver to a COO
Every location diagnosed. Every cycle.
Scoop is AI performance management for distributed businesses. It diagnoses performance at every location, every cycle, and hands every manager a clear action plan.
- Every location, every cycle
- Role-specific action plans
- No prompting required
What is real-time analytics?
Real-time analytics is the practice of analyzing data as soon as it becomes available, instead of waiting for a scheduled batch job.
Real-time analytics is different from traditional analytics, which works on historical or batch-processed data.
"Real-time" is a range, not one fixed speed. Real time analytics breaks it into 3 tiers:
How fast does "real-time" need to be in operations?
The right speed depends on how fast the cost of being wrong builds up.
- A fraudulent card transaction needs a verdict in milliseconds.
- A location whose labor cost is drifting above plan needs a diagnosis within days.
Here is how that maps onto decisions in a distributed business:
What are real-time operational insights?
Real-time operational insights are explanations of what is happening at a location and what to do about it, delivered while there is still time to act.
A signal tells you a number moved. An insight tells you why it moved and what the fix is.
The difference in practice:
- Signal: labor intensity is up at one store.
- Insight: this store's schedule doesn't match the pattern at comparable stores. It is over-staffed in some dayparts and under-staffed in others, so it is paying for hours it doesn't need and missing sales it could capture.
- Action: the store manager gets a specific scheduling change, and next cycle checks whether it held.
Most real-time stacks stop at the signal
There are 2 types of real-time analytics:
- "on-demand", where results arrive only when someone asks
- "continuous", where the system alerts users or triggers responses on its own
Both modes still hand a number to a person who has to interpret it.
That is why investigation tells you why and monitoring only tells you what.
Why doesn't real-time data produce real-time decisions?
Real-time data fails to produce real-time decisions because the slowest step in an operation is human interpretation, and that step doesn't scale.
The pipeline delivers the data in seconds.
The judgment about what it means still waits for a meeting, a ticket or a regional VP's calendar.
A strategy leader at a large multi-location retailer described it plainly:
"By the time someone is able to get back to them, the moment has passed. The moment has passed to be able to action it, because actions take a long time to flow through a big, $12 billion company."
In Confluent's 2025 Data Streaming Report, 86% of 4,175 IT leaders ranked data streaming as an important strategic priority, and 90% planned to increase investment in it.
This means, that companies are already paying for the pipes.
The delay sits in 3 gaps:
The interpretation gap
There are 1,000 reasons a store can underperform:
- Inventory
- Assortment
- Traffic
- New manager
- Staffing
- Shrink
- New competitor
Most operators test about 10 primary hypotheses by hand. A dashboard can't rank them.
The coverage gap
Leadership reviews the top and bottom of the list. The stores costing you margin are usually the ones in the middle that the weekly review never reaches.
The follow-through gap
Without monitoring of whether the standard is followed at every location, the drift problem undoes last quarter's fix before anyone notices.
How does a real-time analytics pipeline work?
A real-time analytics pipeline moves data from source to query without waiting for a scheduled batch. Real time analytics pipeline has 4 stages, each measured in milliseconds to seconds:
- Event generation: POS transactions, PMS updates, sensor readings, clicks and logs produce timestamped events.
- Streaming ingestion: A message broker such as Apache Kafka, Amazon Kinesis or Redpanda buffers the events and keeps them in order.
- Processing: Stream processors such as Apache Flink or Spark filter, enrich and aggregate events as they arrive.
- Query and action: Analytical databases such as ClickHouse, Druid, Snowflake or Databricks serve fresh data to dashboards, alerts and applications.
Most enterprise buyers already run some version of this stack.
What the pipeline does not include:
- A diagnosis of why each location moved
- A ranking of which locations need attention first
- A role-specific action for the manager who owns the fix
That missing piece is the diagnostic and action layer.
Where does real-time operations analytics pay off?
Real-time operations analytics pays off most in businesses that make the same decision many times across many locations.
Every location is a chance for the same small mistake to compound.
Retail
Retail operators watch comp sales, conversion, labor % and inventory at every store, every cycle. The hard part is the diagnosis, which is why a structured why is this store down check beats an alert on its own.
- Comp sales and conversion against similar stores, not just against plan
- Labor scheduling patterns by daypart
- Inventory depth by category and price point
Scoop for retail screens every store and sends the action plan to the manager who owns the fix.
Catch the store problem before it hits the P\&L.
Scoop screens every store, every cycle, for comp sales, conversion, labor, and inventory issues. Then it sends the action plan straight to the manager who owns the fix.
- Comp sales and conversion
- Labor and inventory
- Every store, every cycle
Hospitality
Hotel management companies get revenue data from their PMS. They rarely get operational data on the cost side. In one hospitality engagement covering 140+ independent properties, cost data from QuickBooks was mapped to the USALI accounting standard and compared against PMS revenue.
The finding: cost per occupied room rose from $26 to $34 at a property, traced to a scheduling pattern on slow-occupancy days. The properties had the data all along. Nobody was looking at that combination every cycle.
- Labor efficiency and cost per occupied room
- Energy waste and vendor pricing
- Profitability diagnosis by department
That is the work Scoop for hospitality runs automatically, property by property.
Know it before the owner call.
Scoop monitors RevPAR, labor cost, and channel mix across every property, then surfaces what needs attention while there is still time to act on it.
- RevPAR and channel mix
- Labor cost monitoring
- Every property, every cycle
Franchise and multi-unit groups
For franchisors, real-time means knowing when adherence to a standard starts to slide, not three months after unit economics drop. Scoop for franchise groups monitors every unit against the system standard.
- Unit sales against the system average
- Labor and product cost variance
- Speed of service and guest satisfaction by daypart
Give every franchisee a personal ops advisor.
Scoop gives franchisors visibility into every location and gives franchisees an ops advisor of their own. Same standard, every unit, without adding corporate headcount.
- Visibility across every unit
- An advisor per franchisee
- No added headcount
Private equity roll-ups
Operating partners need a consistent view of portfolio company performance across businesses that run different systems. A red/yellow/green status report is too late and too thin.
- One performance view across portfolio companies
- Location-level variance inside each acquisition
- Value creation opportunities ranked by size
This is the use case behind Scoop's work with private equity roll-ups.
One performance view across the whole portfolio.
Scoop gives operating partners a consistent performance view across every portfolio company, finding value creation opportunities without adding overhead to the deal team.
- Consistent portfolio view
- Value creation signals
- No added overhead
How do you measure whether your business runs in real time?
Measure the time from a signal in the data to a fix at the location. Brad Peters, Scoop's co-founder, calls this decision velocity: the days between a problem appearing in location data and a corrective action being taken there.
4 important metrics:
- Signal-to-action time — Days from the first sign of a problem to the first action at the location.
- Location coverage — The share of locations that get a real review every cycle, not just the top and bottom 10.
- Performance spread — The gap between your best and worst comparable locations. It should shrink as you learn to benchmark locations against each other.
- Follow-through — Whether last cycle's fixes held. Most operators can't say which ones worked.
What should real-time operations analytics software do?
Real-time operations analytics software should deliver a diagnosis and a recommended action for every location, every cycle, not just a faster dashboard.
The streaming and BI stack gets the data ready. The performance-management layer turns it into decisions.
The interpretation layer only works if it carries your operators' judgment, not generic AI logic. Brad Peters describes the capture process like this:
"If we took a tape recorder and recorded everything you thought as you looked at your BI reports, we stick that into the system so it can do that on your behalf."
At one large retail chain, the COO's instincts were captured in a few hours of working sessions. That logic now runs across every store daily, and junior staff catch patterns a 20-year veteran would catch.
What to look for in a vendor:
- Diagnosis, not dashboard summaries: An LLM summary of a chart is not an investigation.
- Codified operator judgment: See how Scoop works: the vendor's team sits with your operators and captures what they check first, which thresholds matter, and which signals they act on.
- Delivery without a login: The report arrives. Nobody has to open a tool or write a query.
- Time to value in weeks: A working pilot should be live in weeks, not after a migration project.
Built for the businesses that run everywhere at once.
Scoop exists to bring best-in-class operational diagnostics to every distributed business, not just the ones big enough to staff a team for it. Meet the people building it.
- Operator-first by design
- Built for distributed teams
- Diagnostics, not dashboards
Frequently asked questions about real time analytics
What is the difference between real-time and batch analytics?
Batch analytics processes data on a schedule, such as hourly, nightly or weekly. Real-time analytics processes data continuously as events arrive.
What are real-time operational insights?
They are explanations of why a location's performance changed and what to do about it, delivered while acting still matters. A real-time operational insight includes three things:
- the signal
- the root cause
- a specific action for the person who owns the fix.
Do multi-location businesses need sub-second analytics?
Rarely. Fraud and pricing need milliseconds. Most location-performance decisions need daily or weekly diagnosis with full coverage. What matters is a read on every unit every cycle, not speed on a handful of them.
What is decision latency?
Decision latency is the time between a problem showing up in the data and a corrective action at the location. It is the inverse of what Scoop calls a new metric for 2027. In most operations, it is measured in weeks even when data latency is measured in seconds.
Will AI agents make operational decisions automatically?
Some decisions, yes. Most location-level decisions benefit more from decision augmentation: AI does the screening and diagnosis, and leaders keep the judgment call. Neil Shepherd argues that AI decision management is where the market is heading. Gartner's forecast that half of business decisions will be AI-augmented by 2027 points the same way.
Does real-time operations analytics replace BI tools?
No. Power BI, Tableau and your warehouse stay where they are. The performance-management layer sits on top of your BI and adds the diagnosis and action step those tools don't provide. The Scoop implementation connects through read-only access, with no data migration.
Get insights like this every week
Analytics, ops strategy, and product updates. No noise.
Keep reading

Where to Find Real-Time Analytics Software for Social Media Data?
Best Real Time Analytics Tools For Financial Data Monitoring?

Which Cloud Services Offer Real Time Analytics Capabilities?
Book a discovery call
Reach out to start a two-way conversation about your industry, your performance variations across locations, and whether Scoop is the right fit for you.