
How do PE operating partners get real-time visibility into portfolio company performance?
Real-time portfolio visibility doesn’t come from a fund-wide BI mandate. It comes from giving portfolio CEOs live, location-level performance data.
How PE Operating Partners Get Real-Time Portfolio Visibility
PE operating partners get real-time visibility into portfolio company performance by equipping each portfolio CEO and operating team with live, location-level analytics, not by mandating a fund-wide BI tool. When the people who own the judgment calls see store-level divergence as it happens, the operating partner inherits that visibility and influences outcomes through better-informed leadership.
I've spent a lot of time with operating partners this year.
Almost every one describes the same frustration: a monthly package that lands weeks after the period closed, and no clean way to see which locations are slipping before the next board meeting.
Most advice on this topic tells you to build a portfolio dashboard and push it down. I think that gets the mechanism backwards. The PE firms leverage data well when the data lives where decisions get made, which is inside the portfolio company, in front of the CEO.
- The problem: financial packages built for boards and LPs, not for operators
- The usual fix: a top-down BI mandate that portfolio companies resist
- What actually works: live real-time analytics at the location level, owned by the CEO and operating team
Why do PE operating partners struggle to get real-time visibility?
The reporting chain was designed to inform investors, not to run operations.
By the time a portfolio company closes its books, assembles a package, and sends it to the sponsor, the numbers describe a business that has already moved on.
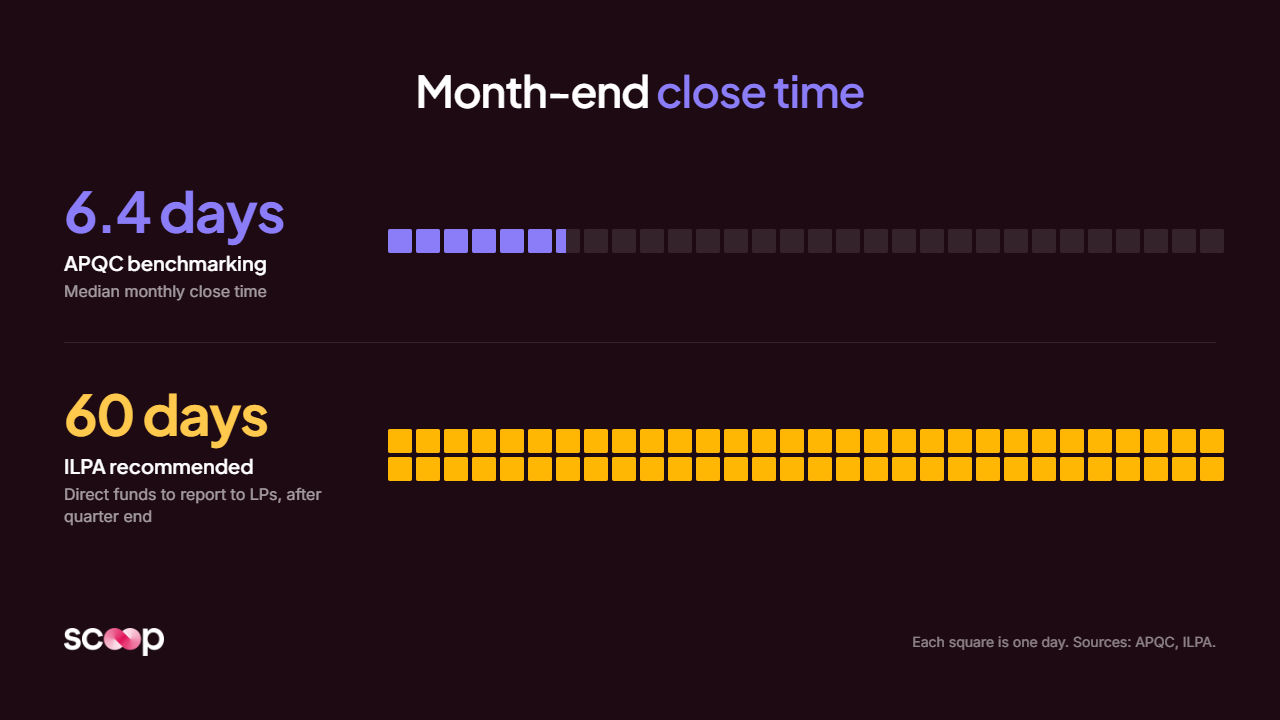
The lag is structural. APQC benchmarking puts the median monthly close at roughly 6.4 days before anyone starts building a board package. Further up the chain, ILPA's recommended timing gives direct funds 60 days after quarter-end to report to LPs.
So the operating partner covering 5 to 15 multi-location companies is reading two-to-three-week-old aggregates.
Those aggregates hide exactly what matters:
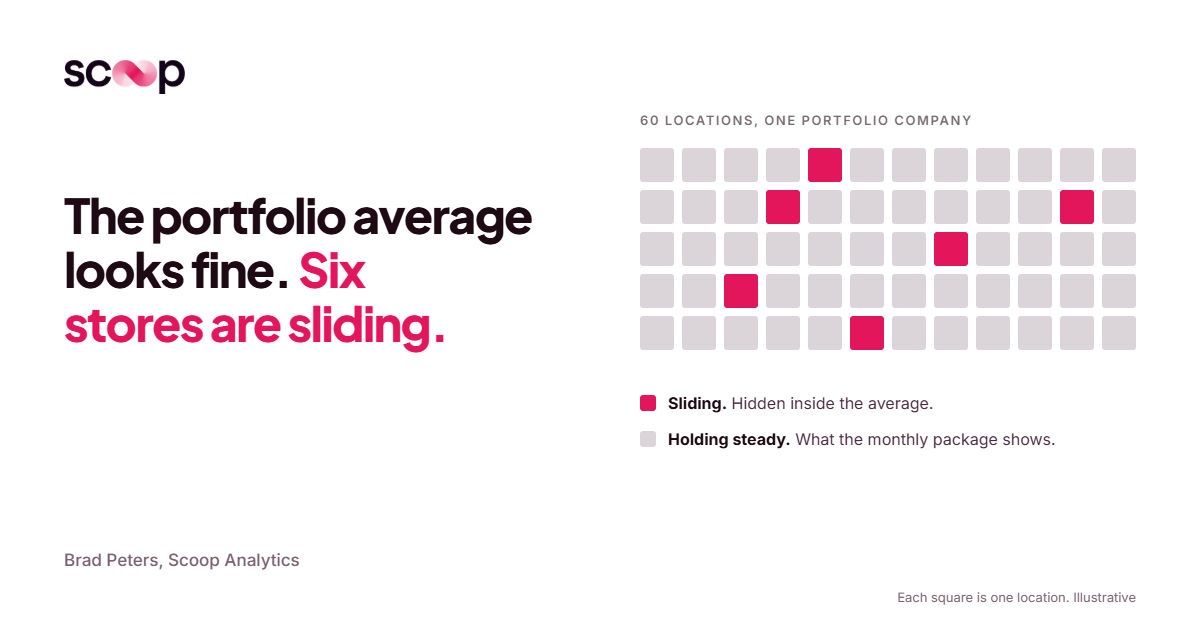
- Location divergence: a portfolio average that looks fine while six stores are sliding
- Drift between meetings: standards agreed in the board meeting that loosen by week three
- The why: a number that moved, with no explanation attached
That last one is the real bottleneck. As a franchise operator told me:
"You see this dashboard, and something goes up or down, and that just begs the question." Partner operator
Why doesn't a fund-level BI mandate fix the problem?
Because PE is federated. The operating partner advises; the portfolio CEO decides.
"The buck doesn't stop with us in the sense that I have to make things happen through a CEO because that's the direct line of getting stuff done… CEOs own quite a lot of the judgment calls, not so much the operating partners." Partner operator
That reality shows up in the data. In Simon-Kucher's value creation research, 35% of failed initiatives traced back to portfolio company resistance and 53% to poor implementation.
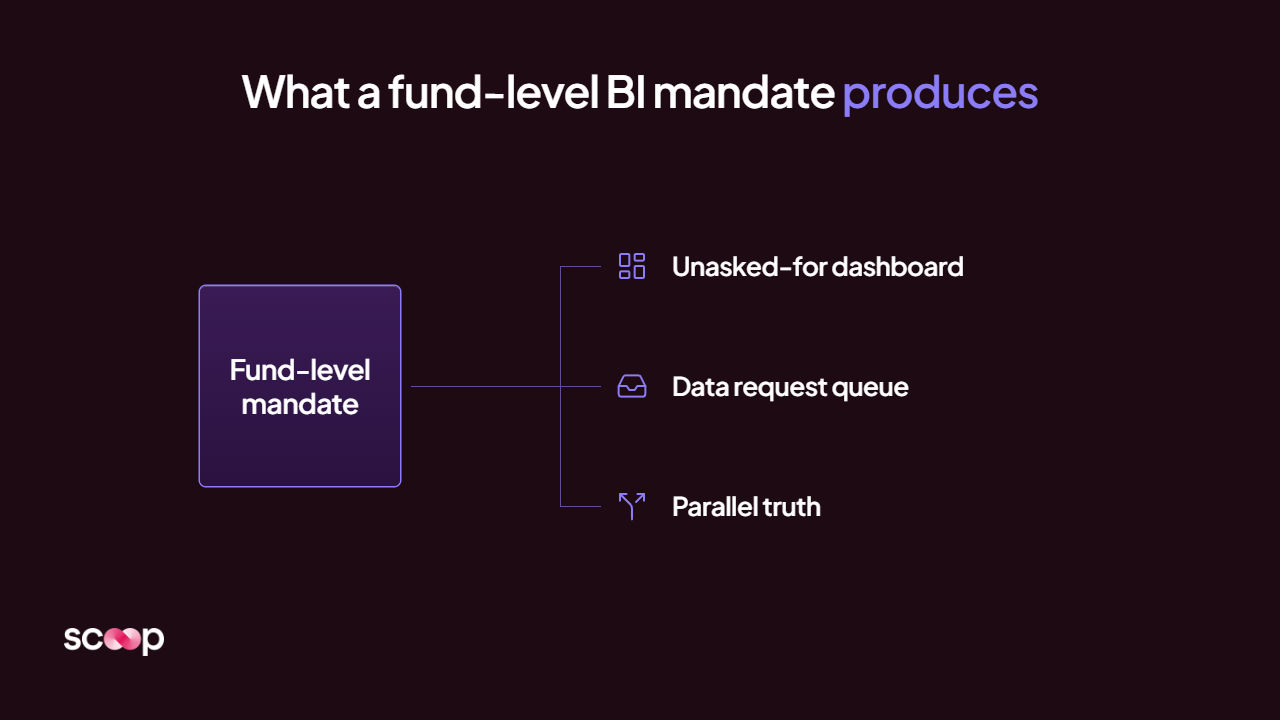
A mandate tends to produce three things:
- Another dashboard the CEO didn't ask for, which the operating team quietly ignores
- A data request queue, where the finance team rebuilds one-off pulls for the sponsor
- A parallel truth, where the fund's view and management's view disagree in the board room
None of that is a technology problem. I've said for years that BI projects fail about half the time, and it's generally because the people implementing them don't understand the business problems.
Pushing a tool from the fund level makes that gap wider, not narrower.
What data do portfolio CEOs actually need day-to-day?
Portfolio CEOs need location-level performance, compared over time and against peers, with the reason attached. Monthly totals don't tell a restaurant or hotel CEO where to send the district manager on Monday.
The scale makes this urgent. The International Franchise Association projects 845,000 franchised establishments in the US in 2026. Every one of them is a unit that can drift independently.
What a CEO running 40, 200, or 1,200 locations actually needs:
- Each location against its own baseline, not just against the budget
- Each location against its peers in the same company, same region, same format
- Leading indicators that move months before the P&L does
- Root cause, so the conversation starts with the fix, not the forensics
Without that, diagnosis eats the week. A franchise leader told me his field ops consultants spend half of every franchisee call just explaining how they reached the diagnosis.
That's what good operational analytics should compress, and it's why diagnostic analytics matters more than another summary view.
"When a store is doing poorly, there are literally 1000 reasons why that can be... it is usually death by 1000 cuts." (Mass retail operator)
What does store-level forensics look like in practice?
Store-level forensics means comparing every location's performance over time to find where they diverge, and why.
It's the difference between knowing the portfolio is "down 3%" and knowing which locations carry the decline.
One example sticks with me. A multi-location operator wanted to know which of its stores had recovered to pre-COVID performance and which had not. Their own team couldn't run the analysis internally. The data existed; the comparative time-series analysis across every location didn't.
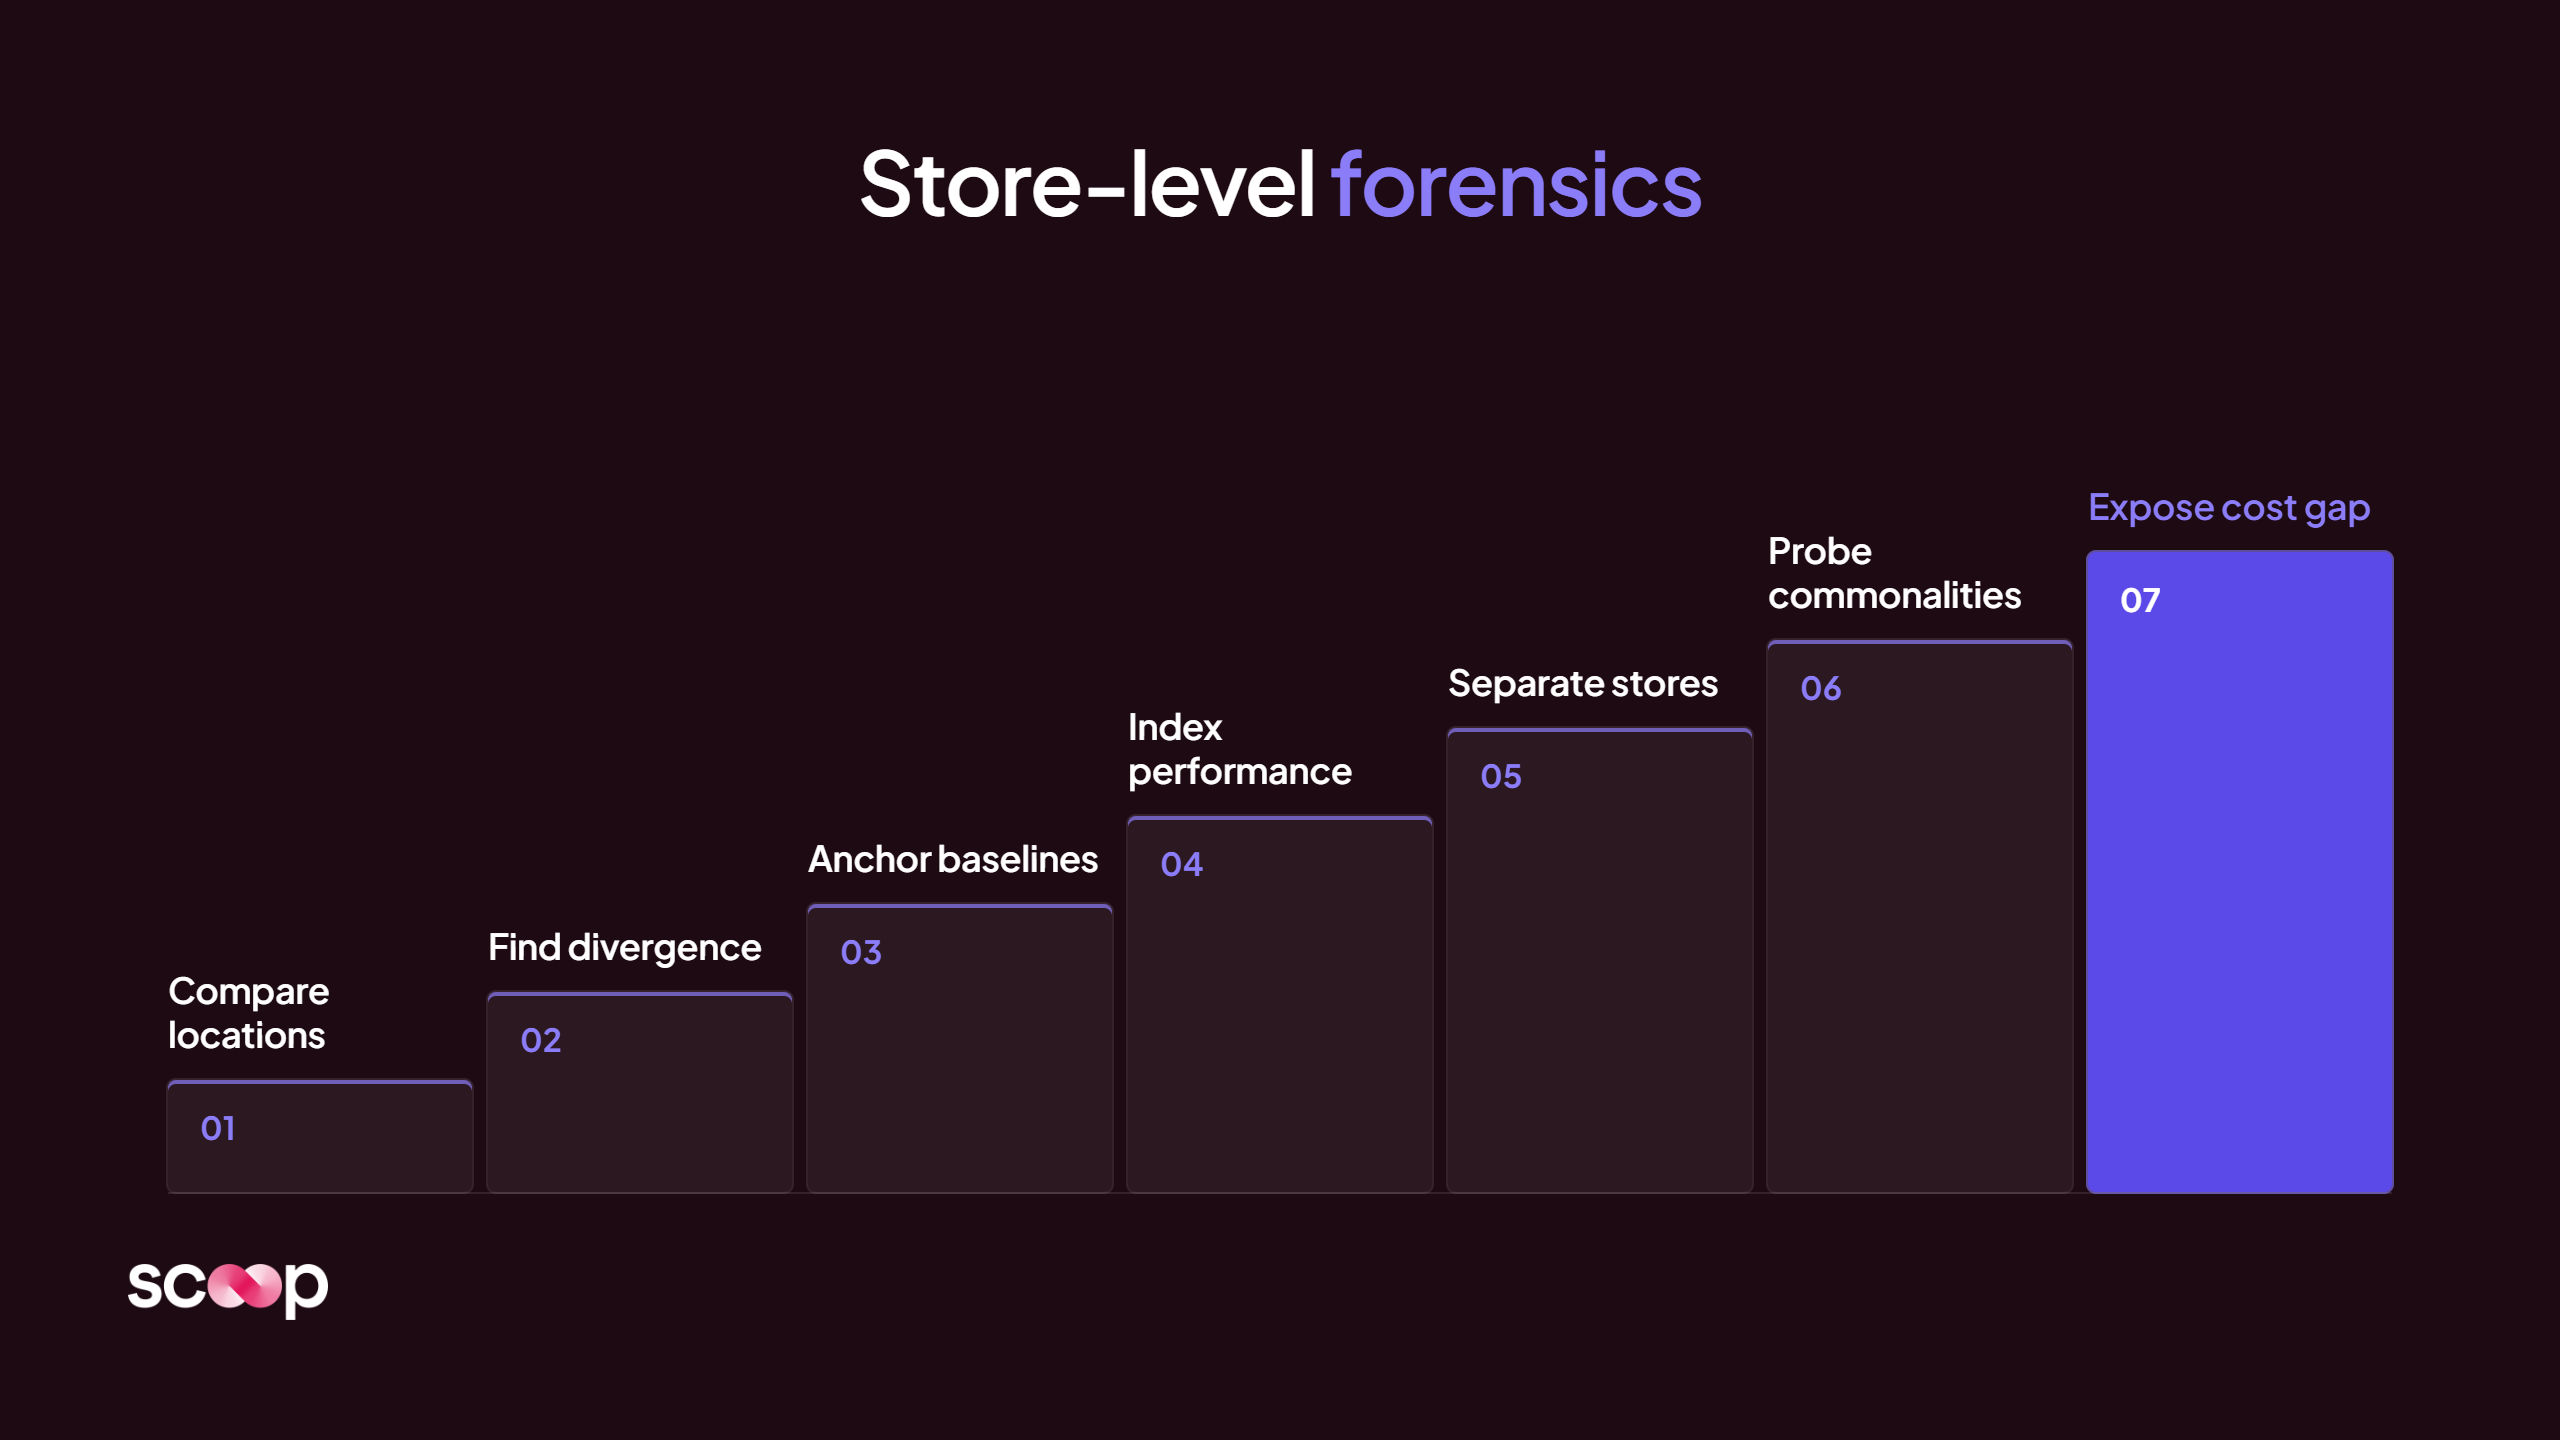
The mechanics are straightforward once the system runs them:
- Anchor each location to its own pre-COVID baseline
- Index current performance against that baseline, location by location
- Separate the recovered stores from the stalled ones
- Probe what the stalled group has in common: format, region, staffing, mix
This is why precise time-series analysis beats a portfolio average. Averages smooth exactly the location performance divergence an operating partner needs to see.
The ability to compare time periods location by location is what turns a vague concern into a specific conversation.
Hospitality shows why this matters now. CoStar data shows 2025 was the first year since 2020 that US hotel occupancy and RevPAR both declined, with occupancy at 62.3%.
A hotel operator once told me:
"no one in the market benchmarks operational costs (labor, energy) against occupancy. It's all revenue."
That's a forensic gap, not a data gap.
How does live operational data make an operating partner's influence effective?
Live data changes what the operating partner can ask. Instead of "what happened last month?" the question becomes "what's the plan for the eight stores that haven't recovered?"
The returns math demands that shift. Bain's 2026 Global Private Equity Report found that a deal now needs roughly 10% to 12% annual EBITDA growth to hit the returns 5% delivered in the 2010s.
Average buyout holding periods have stretched to about seven years.
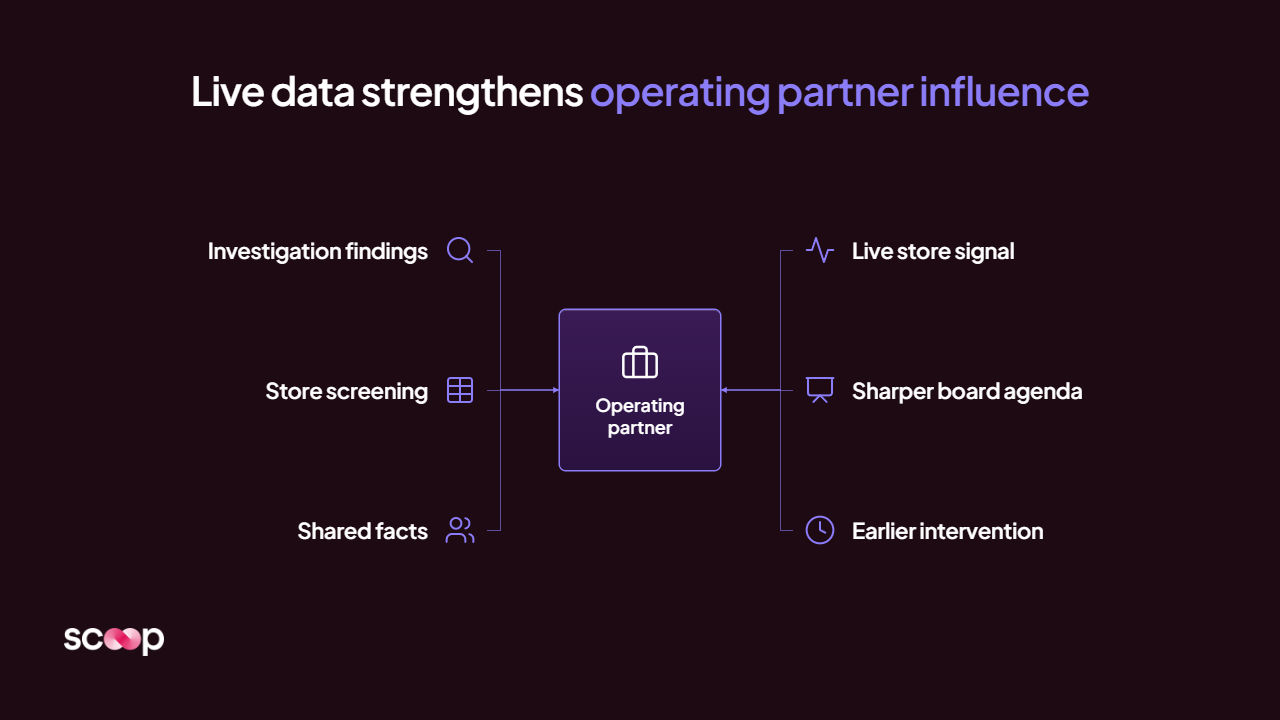
When the CEO and operating team have live, location-level signal, the operating partner gets:
- A sharper board agenda: a board deck built around flagged locations, not recycled totals
- Earlier intervention: an early warning on drift weeks before it hits the quarter
- Shared facts: management and sponsor reading the same diagnosis
We built this for the largest second-hand retail chain in the United States. We spent a week in the field with their COO and district managers, recording how they read their Power BI across 11 stores. Now every store gets screened every cycle, and the findings roll up from store to district to region.
Junior staff catch patterns a 20-year veteran would catch, because the investigation tells you why, not just what.
How do you set this up without asking the portfolio company to rip anything out?
You don't replace anything. The visibility layer sits on top of the BI, warehouse, and spreadsheets the portfolio company already runs.
The same Simon-Kucher research shows firms reviewing value creation plans every 3 to 6 months is expected to rise from about 20% to 39%.
Faster review cycles need faster signal, and nobody has appetite for a migration project mid-hold.
How it works with Scoop:
- Capture: our team sits with the company's best operators. As I describe it: "If I took a tape recorder and recorded everything you thought as you looked at your BI reports, we stick that into the system so it could do that on your behalf."
- Codify: that interpretation logic becomes the screens and probes that run on every location
- Screen every cycle: each location is checked for year-over-year deviations, balance ratios, and early warning signals
- Report: a report arrives with what changed, why, and what to do, sized for the CEO, the regional VP, and the store
What should an operating partner do before the next board meeting?
Start by asking the CEO one question: which locations are diverging from their own baseline, and why? If the answer takes a week and a finance request, the visibility gap is confirmed.
"Things unravel." (Founder, hotel management group)
Then work through the CEO, not around them:
- Ask for divergence, not totals. Location against its own history and its peers.
- Ask for the why. A flag without a root cause just starts another data pull.
- Ask what changed since the last meeting. Drift lives between board cycles.
- Offer the capability, not the mandate. Give the operating team the tool; let them own the judgment.
This is what I mean by AI performance management: your best operator's judgment, running across every location, every cycle, delivered to the people who own the decisions.
The operating partner's influence gets sharper because the CEO's visibility got sharper. That's the only direction this works.
Built for the businesses that run everywhere at once.
Scoop exists to bring best-in-class operational diagnostics to every distributed business, not just the ones big enough to staff a team for it. Meet the people building it.
- Operator-first by design
- Built for distributed teams
- Diagnostics, not dashboards
Frequently asked questions
What is the difference between a PE operating partner and a portfolio company CEO?
The CEO runs the business and owns the judgment calls. The operating partner works for the PE firm and advises across several portfolio companies, often bringing sector or functional expertise.
INSEAD research cited by Accordion identifies three operating partner models: industry experts, functional specialists, and generalists.
- CEO: decision authority inside one company
- Operating partner: influence across many, exercised through the CEO
Firms that run PE and VC portfolio reviews well respect that line.
How often should portfolio companies report operational data to PE sponsors?
Financial reporting to LPs runs quarterly, with ILPA guidance of 60 days after quarter-end for direct funds. Operational signal should run far faster.
- Board and LP reporting: monthly or quarterly
- Location-level operating signal: weekly or every two weeks
The second-hand retail chain deployment runs every two weeks today, with weekly as the target. The goal is to measure operational performance at the cadence the business actually moves.
Does real-time visibility mean the operating partner gets direct access to portfolio company data?
Not necessarily, and it shouldn't have to. The CEO and operating team own the data and the analysis; the operating partner sees what the CEO chooses to share in the board conversation.
- Data stays in the portfolio company's environment
- Findings travel through management, in context
That's how AI investigation supports the federated model instead of fighting it.
Can operating partners compare locations across different portfolio companies?
Sometimes, but only after each company has consistent definitions. Simon-Kucher notes that portfolio-wide comparison requires standardized KPIs and consistent reporting.
- Start inside each company: location against location
- Extend across the fund only where formats and metric definitions truly match
Within one company, anomaly detection across locations delivers value long before cross-portfolio benchmarking is ready.
Get insights like this every week
Analytics, ops strategy, and product updates. No noise.
Keep reading
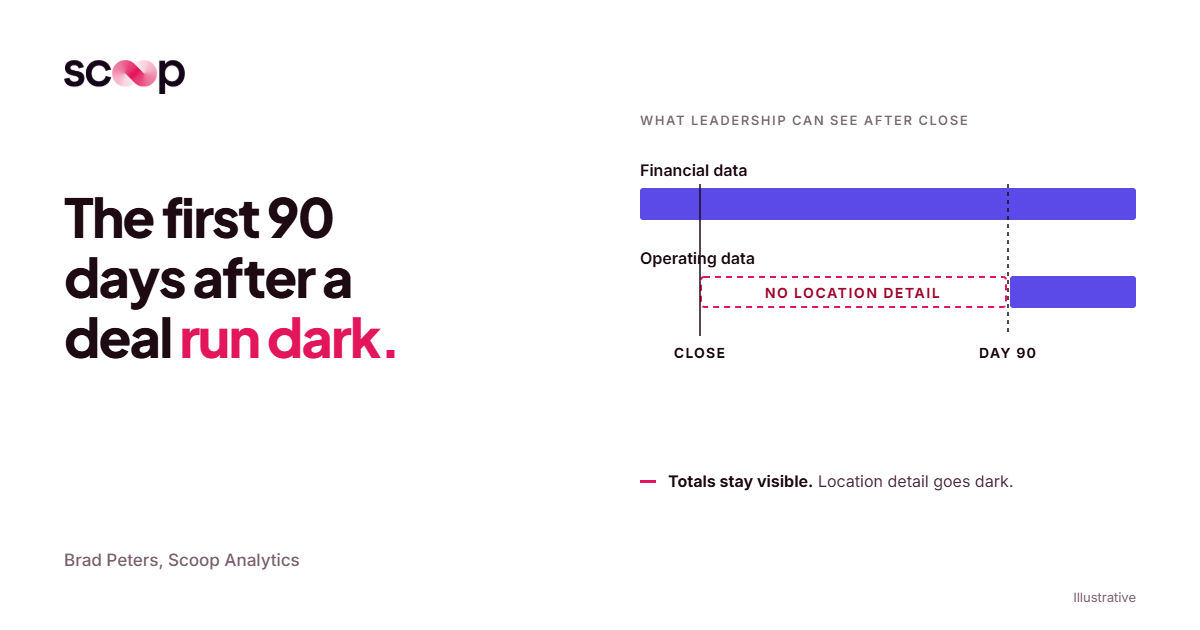
What happens to operational visibility in the 90 days after an acquisition?
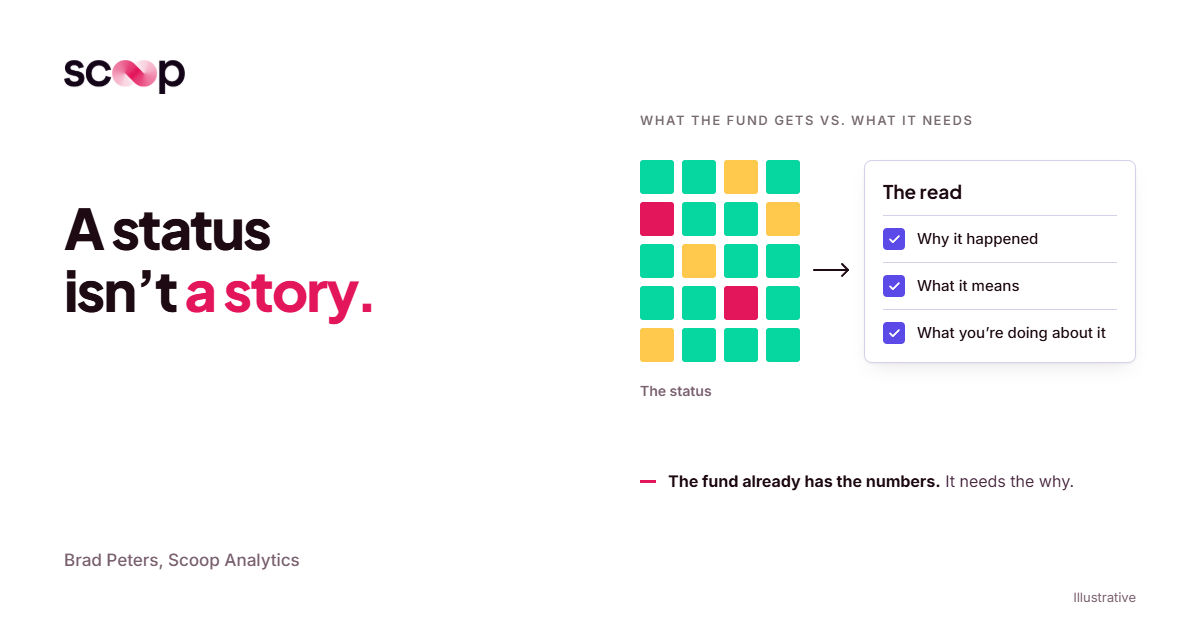
The Red/Yellow/Green Trap: Why PE Operating Reports Need a Story, Not a Status
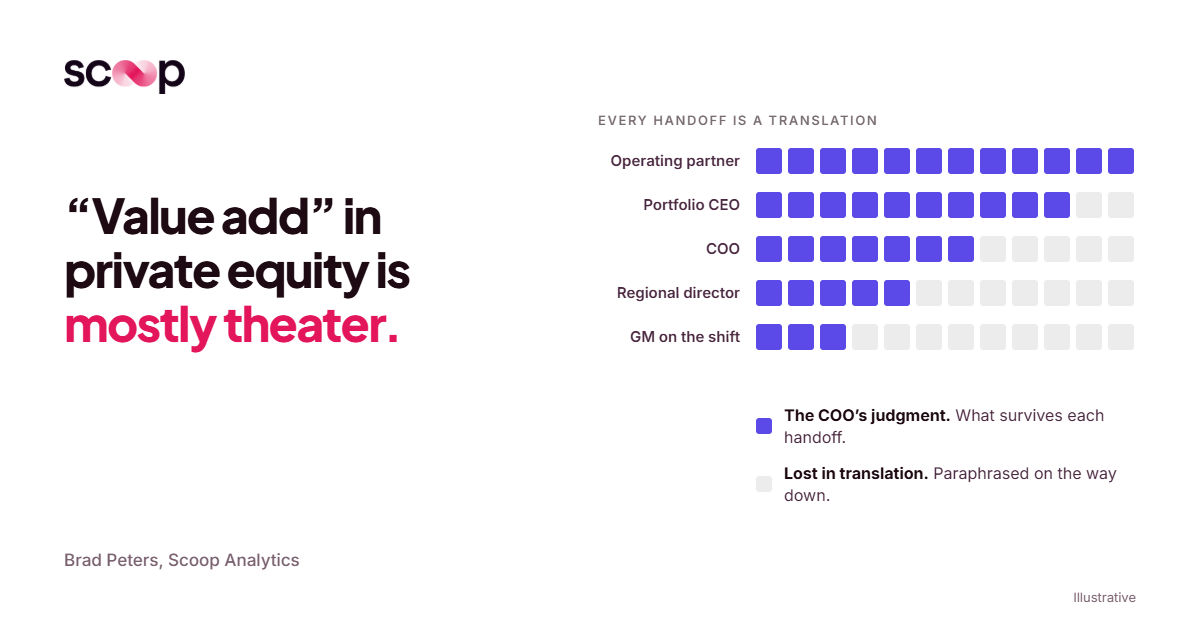
Why “value add” in private equity is mostly theater (and what would actually fix it)
Book a discovery call
Reach out to start a two-way conversation about your industry, your performance variations across locations, and whether Scoop is the right fit for you.