
How Business Intelligence Helps in Decision Making
How business intelligence helps decision making, where it stops, and the AI layer that turns BI into a diagnosis and an action plan for every location.

How does business intelligence help in operational decisions?
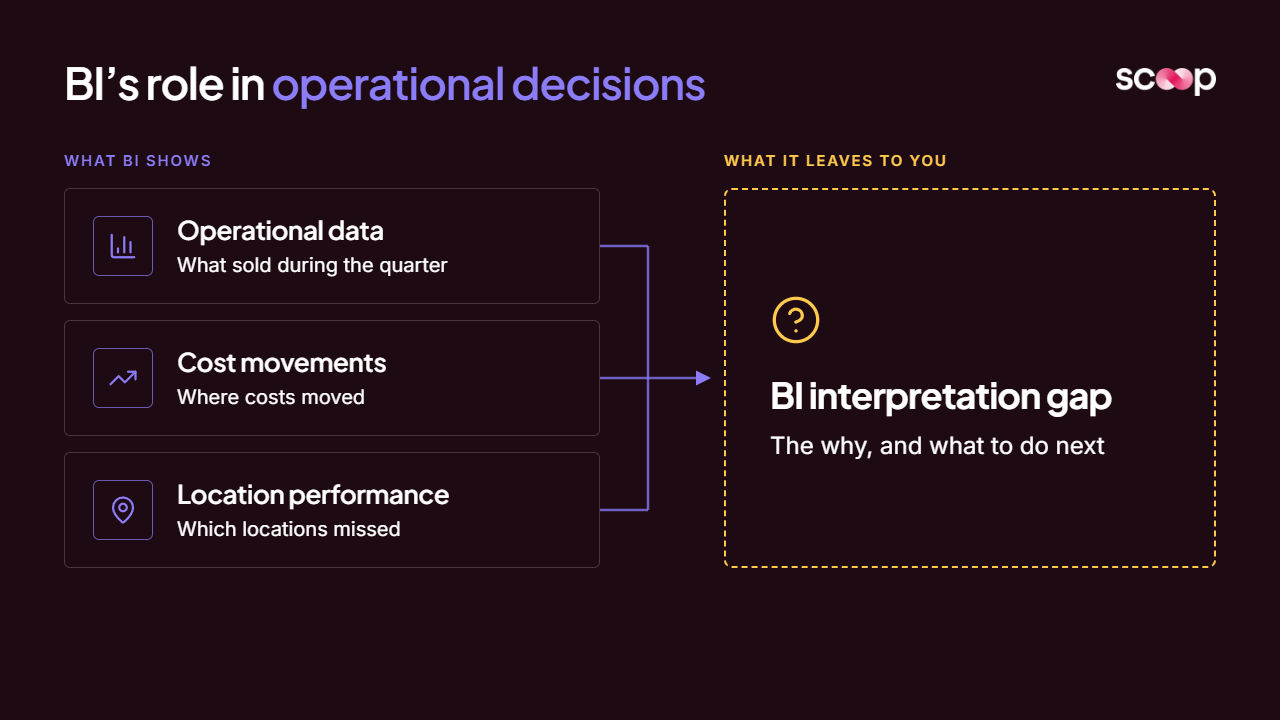
Business intelligence helps decision making by turning operational data into a shared, current view of performance:
- What sold during the quarter
- Where costs moved
- Which locations missed
That speeds up decisions and replaces opinion with evidence. Business Intelligence stops at what happened, though.
The why and the what-to-do-next still depend on someone interpreting the dashboard, and that layer rarely scales.
That gap is where most of the value leaks out.
This guide covers three things:
- What BI does well for leaders
- The concrete decisions BI improves
- Where BI stops helping
- How AI performance management adds the interpretation on top of the BI stack you own
What is business intelligence in decision making?
Business intelligence in decision making is the use of data infrastructure, reports, and dashboards to give leaders a reliable picture of performance before they choose a course of action.
The standard definition of business intelligence covers the strategies and technologies companies use to analyze business information.
For a COO or CFO, business intelligence basics come down to one thing: the numbers are in one place, they refresh on schedule, and everyone sees the same version.
BI work maps onto four types of analytics.
Descriptive: what happened?
Sales by store, labor cost % by week, occupancy by property. This is BI's home turf.
Diagnostic: why did it happen?
BI offers drill-downs, but diagnostic analytics still depends on a person running the investigation.
Predictive: what will happen?
Forecasts can sit inside BI, usually as a separate model someone maintains.
Prescriptive: what should we do?
Rarely in BI at all. The recommendation lives in a leader's head or a meeting.
Built for the businesses that run everywhere at once.
Scoop exists to bring best-in-class operational diagnostics to every distributed business, not just the ones big enough to staff a team for it. Meet the people building it.
- Operator-first by design
- Built for distributed teams
- Diagnostics, not dashboards
How does business intelligence improve decision making?
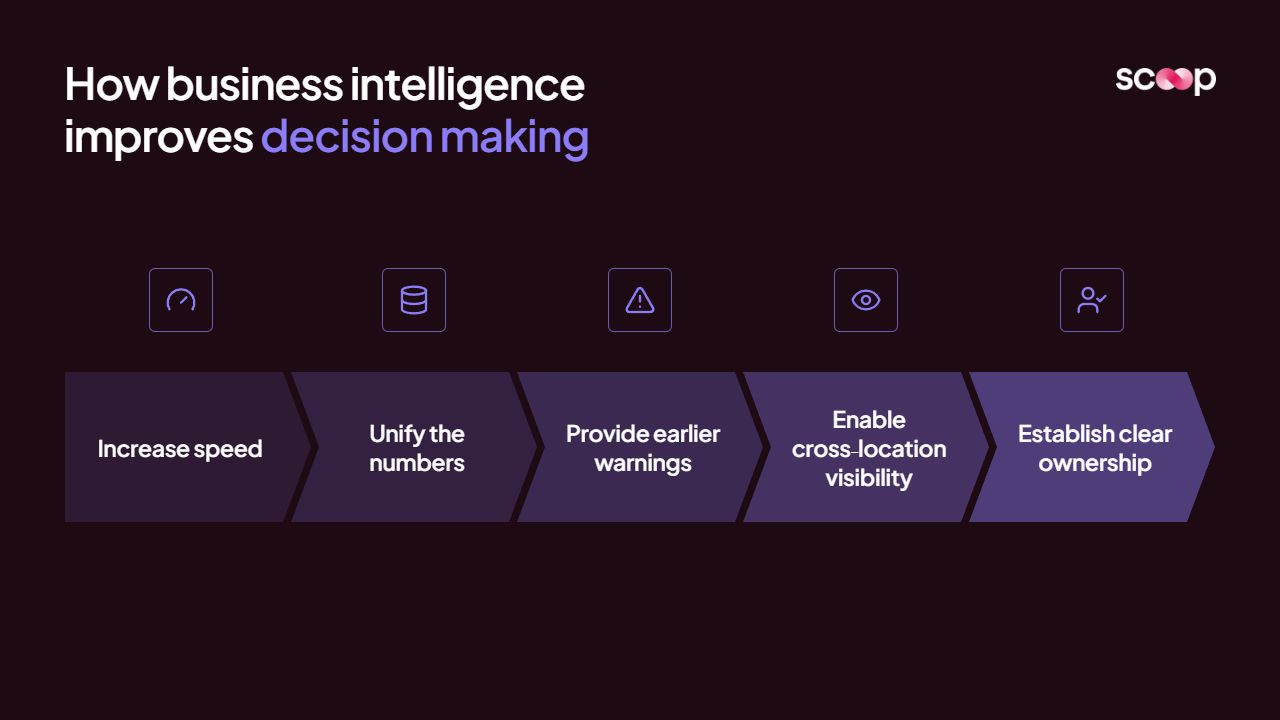
Business intelligence helps in decision making at its best: faster, shared, earlier.
BI improves decisions in five concrete ways. Each one shows up in a specific meeting, a specific number, or a specific call an executive makes.
Speed
Hand-built weekly spreadsheets give way to dashboards that refresh on their own.
In one case, a mid-sized retailer cut pricing decisions from two weeks to under 48 hours after adopting an AI-powered BI tool.
One version of the numbers
POS sales, scheduling hours, and general ledger costs land in one model.
The Monday meeting argues about the decision, not about whose spreadsheet is right.
Earlier warnings
Thresholds on labor cost %, shrink, or occupancy flag a slide before the month-end close instead of after it.
Visibility across locations
A COO running 200 units can rank every one on comp sales, food cost %, or RevPAR in a single view.
Clear ownership
A shared KPI set makes it obvious who owns which number.
What does a BI decision workflow look like?
A BI decision workflow runs in five steps. Most BI stacks automate the first four. The fifth, where the decision actually happens, still runs on people.
- Collect: Pull from POS, PMS, ERP, CRM, scheduling, and the general ledger.
- Store and clean: Load into a data warehouse or lakehouse. Standardize store IDs, fiscal calendars, and cost codes so locations compare fairly.
- Analyze: Define metrics, comparisons, and drill paths.
- Visualize: Publish dashboards and scheduled reports.
- Interpret and act: Someone reads the report, decides what it means, picks an action, and follows up next cycle.
Your dashboards show what happened. Scoop says what to do.
Scoop adds the diagnostic and action layer your BI tools cannot: finding what needs attention across every location, and what to do about it. Your stack stays exactly where it is.
- Sits on top of your BI
- Diagnostic and action layer
- No migration required
Where does business intelligence stop helping?
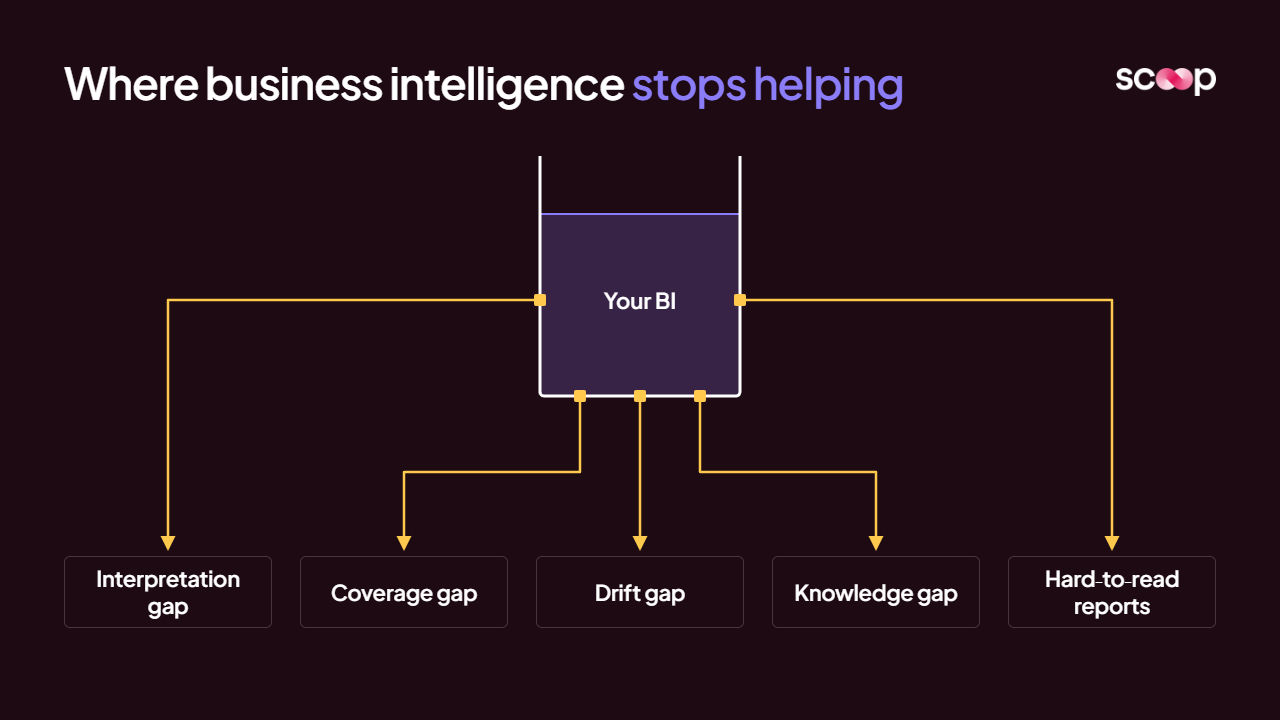
BI stops at interpretation. It shows that a number moved. It does not say why, whether it matters, or what each person should do about it, at every location, every cycle.
Four gaps show up in almost every distributed business:
The interpretation gap
Diagnosis is manual. Diagnostic analysis as analysts using SQL queries, statistical methods, or drill-downs to isolate causes. That is days of work per question.
The coverage gap
A leadership team has the hours to dig into a handful of locations each week. The rest get a glance. The stores costing you margin are exactly the ones the weekly review never reaches.
The drift gap
A standard gets set, rolled out, and then slowly erodes. BI shows the result months later. This is the drift problem, and an independent hotel operator put it in five words: "Five days later, some things can unravel."
The knowledge gap
The person who knows how to read the report retires, gets promoted, or leaves. Multi-location businesses lose operational knowledge every time that happens.
The interpretation gap is quieter
A sourcing and quality leader at a national retailer described it this way:
"I'm reading the distribution reports and it makes sense to them, but it doesn't make sense to me. But I've been getting that report for so many years, it's hard to ask."
That is not a skills problem. It is a design problem. Reports were built to display information, not to explain it. Where business intelligence stops helping is precisely where the decision begins.
Business intelligence vs decision intelligence
Business intelligence reports on performance.
Decision intelligence models the decisions themselves:
- The inputs
- The logic
- The action
- The outcome
So decisions can be recommended or automated.
Decision intelligence grew out of decision theory and management science, and as an engineering discipline that augments data science.
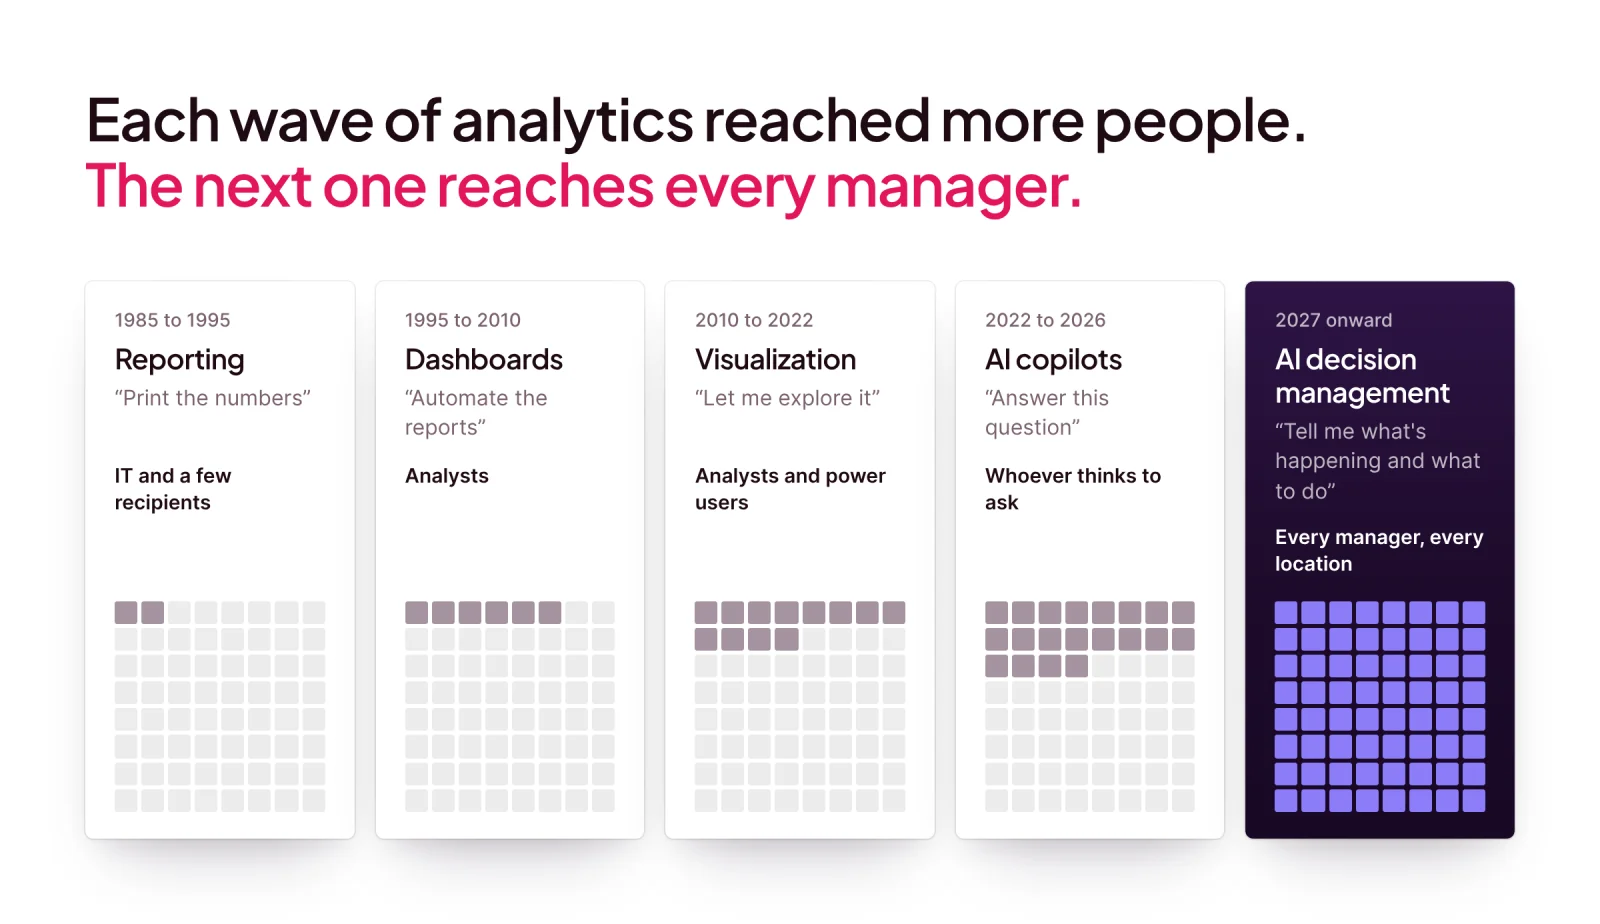
By 2027, 50% of business decisions will be augmented or automated by AI agents for decision intelligence.
Augmented is the important word. Scoop’s CEO Brad Peters draws the line on decision augmentation: automating a reorder is one thing; automating a regional VP's judgment about a struggling store is another.
Where do decision operations fit?
Decision operations is the operating discipline around decisions: who decides, on what cadence, with which inputs, and how the outcome gets checked. BI feeds it. Decision intelligence tools model it. Neither runs it on their own.
A decision operations review asks four questions:
- Which recurring decisions matter most (pricing, staffing, capex, store interventions)?
- Who owns each one, and how often is it made?
- What evidence does the owner see before deciding?
- How does anyone know, next cycle, whether it worked?
Codify what your best operators already know.
Scoop captures your operators' tribal knowledge, screens every location automatically, and delivers role-specific action plans. Nobody writes a prompt. The plan just arrives.
- Codified tribal knowledge
- Automatic screening
- Action plans, not dashboards
How do executives close the gap without replacing BI?
Keep the BI stack. Add a layer that reads it the way your best operator would, at every location, every cycle, and delivers the result as a report. That is AI performance management.
Scoop sits on top of your existing BI: Power BI, Tableau, the warehouse, the PMS, the POS. Nothing gets ripped out.
The mechanism runs in five steps:
Capture the judgment
Scoop's team sits with your COO, regional VPs, or most experienced operators during setup. Brad Peters describes it plainly:
"If I took a tape recorder and recorded everything you thought as you looked at your BI reports, we stick that into the system so it could do that on your behalf."
Screen every location
Screening lenses built from that judgment run across every unit, every cycle, and flag what moved.
Probe the flags
Diagnostic probes investigate each flag.
A machine learning probe looks at 10 to 20 variables at once and compares the current period with a healthier prior one, catching multi-variable patterns a two-dimensional drill-down misses.
Synthesize and roll up
Findings are written at the location level, then roll up:
- Store
- District
- Region
- Division
Each role sees its own view, scored critical, severe, normal, or healthy.
Deliver the report
The report arrives on schedule. Nobody logs in, builds a query, or triggers a workflow.
What this looks like in retail
A large multi-location retail chain was the first to run this way.
"We literally went in with the senior managers, recorded their entire process of how they think about looking at the information."
That logic now runs across every store, every cycle.
Each store report contains:
- A short summary of what changed
- Core operating metrics with year-over-year trends
- The specific flags the store hit
- Drill-down findings on customers, staff patterns, and inventory health
- The single biggest driver of the change
- Recommended actions for the people who own that store
The practical effect:
Junior staff catch the patterns a 20-year veteran would catch. This five step check for a store that is down shows the same investigative logic, and his follow-up on which fixes worked shows why tracking last cycle's actions matters as much as finding this cycle's problems.
What this looks like in hospitality
Independent hotel operators describe a squeeze: RevPAR down 6.8% from 2019, costs up 25%. The big brands have operational benchmarking. Most independents do not.
The same layer gives them a property-by-property read on:
- RevPAR, ADR, and occupancy against comparable properties
- Labor cost % and housekeeping productivity
- F&B cost variance
- Adherence to the standards the operator already set
Every location diagnosed. Every cycle.
Scoop is AI performance management for distributed businesses. It diagnoses performance at every location, every cycle, and hands every manager a clear action plan.
- Every location, every cycle
- Role-specific action plans
- No prompting required
What limits should leaders plan for?
Any BI or AI layer inherits the condition of the data and the organization around it. Three limits are worth planning for up front:
Data quality
Garbage in, garbage out still applies. But waiting for perfect data stalls everything. The case against clean data first is simple: the investigation itself surfaces which data problems matter.
Governance and access
Treat this as a data governance question, not an afterthought. Scoop is SOC 2 Type II certified, connects read-only, and needs no data migration.
"We never own it, we never touch it, we never see it."
Trust and adoption
A report nobody trusts changes nothing. The fix for the AI trust problem is visible evidence behind every conclusion and a human in the loop:
“Not AI let loose where it just goes running rampant."
Live in weeks. Not months.
We connect to your data, codify your playbook, and train your team. You see a working pilot before anyone commits to a full rollout.
- Connect your data
- Codify your playbook
- Pilot before rollout
Frequently asked questions about how Business Intelligence helps in decision making
How does business intelligence help managers make decisions?
BI gives managers one current, shared view of performance: sales, costs, labor, and customer metrics by location and period. That shortens the time to a decision and replaces debate over numbers with debate over action. It does not explain why a number moved. Brad's list of dashboard blind spots shows where managers still get stuck.
What are the four types of analytics in business intelligence?
Descriptive (what happened), diagnostic (why), predictive (what will happen), and prescriptive (what to do). Traditional BI covers descriptive analytics well and supports diagnostic work through manual drill-downs. Predictive and prescriptive work usually happens outside the BI tool.
What is the difference between business intelligence and decision intelligence?
Business intelligence reports what happened. Decision intelligence models the decision itself so it can be recommended or automated. Brad's argument for why business intelligence isn't actually intelligent gets at the core issue: interpretation was never part of BI's job.
Will AI replace business intelligence tools?
No. AI layers depend on the data models, governance, and metrics BI teams already built. The question of whether AI will replace business intelligence usually resolves the same way: AI adds interpretation on top, and the BI foundation stays.
How long does it take to add AI performance management on top of BI?
Scoop goes live in weeks: about four weeks from kickoff to a working pilot. Setup takes roughly 8 to 12 hours of executive and IT time, mostly in sessions where Scoop's team captures how your operators read their reports.
How do you measure whether BI is improving decisions?
Track three things: time from signal to decision, how many locations get a real review each cycle, and whether last cycle's actions moved the number. The spread between best and worst locations is the clearest single signal, and the cost of location performance variance is usually larger than leadership expects.
Get insights like this every week
Analytics, ops strategy, and product updates. No noise.
Keep reading

What Is Decision Intelligence?
How is Agentic Analytics different from traditional BI (Business Intelligence) or AI dashboards?
In the future, every manager will have an AI decision agent
Book a discovery call
Reach out to start a two-way conversation about your industry, your performance variations across locations, and whether Scoop is the right fit for you.